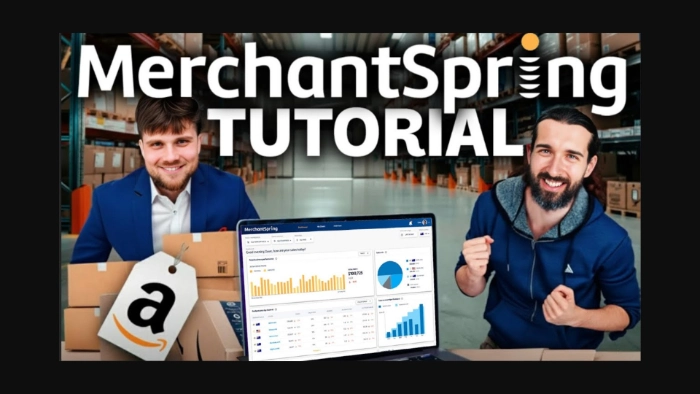
MerchantSpring Tutorial & Review - See All Your eCommerce Channels in One Sales Dashboard
-
Getting Started with MerchantSpring
-
MerchantSpring Coupon Code
-
MerchantSpring Academy
-
The Main Areas of MerchantSpring
-
All-in-One Marketplace Connectivity
-
The Time-Saving Advantage
-
MerchantSpring Dashboard
- Dashboard Customization Options
- Tagging and Account Organization
-
My Channels
-
My Channels Side Menu
-
Channel Overview
- Traffic and Conversion Metrics
- Lifetime Value
- Repeat Purchases
- Subscribe and Save
- Cancellations and Refunds
-
Sales Insights
- Sales by Category
- Sales by Country
- Sales by Brand
- Sales by Group
- Sales by Product
- Sales by Parent
- Top and Worst Sellers
- Sales Targets
-
Profitability
- Channel Profit
- Monthly Profit
- Product Profit
-
Channel Listings
- Content Change Alerts
- Suppressed Products
-
Buy Box Performance
- Who Needs This Feature THE Most
- Use Cases Across Different Seller Types
-
Operations
- Account Health
- Overdue Orders
- Review Management
- Out of Stocks
- FBA Inventory
-
Marketing
- Marketing Overview
- Campaigns by Group
- Campaigns
- Ad groups
- Products
- Product Ads
- Keywords
-
Reports
-
White Labeling with MerchantSpring
-
Vendor Overview
- Retail Analytics
- Purchase Orders
- Profitability
- Additional Features Similar to Seller Central
-
eBay Seller View and Multi-Marketplace Flexibility
-
Useful Tips for Sellers Exploring MerchantSpring
-
Adding a Channel
-
How Long Does the Data Take?
-
MerchantSpring Pricing Overview
-
Pricing for Brands and Manufacturers
- Monthly vs. Annual Options
- What's Included?
-
Pricing for Agencies and Service Providers
-
MerchantSpring Free Demo and Trial Access
-
Release Notes
-
Final Words
Disclosure: Hi! It's Vova :) Some of the links in this article may be affiliate links. I get a commission if you purchase after clicking on the link, this does not cost you more money, and many times I can even get a nice discount for you. This helps me keep the content free forever. For you. Thank you! :)
MerchantSpring is a centralized analytics and reporting tool built for Amazon sellers, agencies, brands, and investors managing multiple marketplaces.
It helps you track sales, monitor performance, and simplify reporting across platforms like Amazon (FBA/FBM), eBay, Walmart, and Shopify.
This guide walks you through how to use MerchantSpring, from initial setup to understanding its core features.
You’ll learn:
How the MerchantSpring dashboard works
Which seller and agency pain points the platform solve
What’s included in the demo account (and what isn’t)
How to access training resources like the MerchantSpring Academy
An overview of pricing and plan options so you know what to expect
Getting Started with MerchantSpring
MerchantSpring is built for users managing multiple eCommerce accounts across various marketplaces.
It’s commonly used by:
Amazon FBA and FBM sellers
eCommerce brands selling on multiple channels
Agencies managing multiple clients
Investors or aggregators analyzing portfolio performance
To start using MerchantSpring, you can sign up for a free demo.
While MerchantSpring provides several demo accounts for internal use and presentations, it’s strongly recommended to connect 1–3 of your own accounts during the trial.
That’s because live data is more insightful and valuable.
During setup, you'll be prompted to connect your marketplace accounts for real-time data access.
This setup allows MerchantSpring to pull in your actual performance metrics.
So instead of relying on generic demo data, you can see your own metrics, compare performance across marketplaces, and identify actionable opportunities in a better way.
MerchantSpring Coupon Code
I welcome you to save 10% OFF with MerchantSpring by using coupon code VOVA10.
MerchantSpring Academy
For users who want deeper training, MerchantSpring also offers a free video-based course through the MerchantSpring Academy.
It includes tutorials from the company’s founder and covers different parts of the platform in detail.
The total course length is approximately two hours.
You can access the Academy through the button below alongside available offers and free demo booking options.
Now as you know where to find training and support, let’s break down the main areas of the MerchantSpring platform and how each one works.
The Main Areas of MerchantSpring
When you log in to MerchantSpring, you’ll see three main tabs at the top of the screen, which make up the core areas of the platform.
Dashboard – A high-level overview that brings together all your connected marketplaces and advertising channels.
My Channels – This is the more detailed, data-heavy section where you dive into specific metrics for each marketplace.
Reports – A feature built especially for agencies and internal teams. It lets you generate clean, automated reports for stakeholders without needing them to log into the tool.
Each of these areas plays a different role in how you monitor and manage your sales performance across all connected marketplaces and channels.
All-in-One Marketplace Connectivity
MerchantSpring supports over 160 different integrations, including both major and niche marketplaces as well as ad platforms.
This means you can connect and track performance from Amazon, eBay, Walmart, and Shopify, as well as regional or smaller marketplaces.
So, if you're based in the US and want to expand into South America, or selling in the UK and want to grow into Germany, MerchantSpring can support that.
It’s not limited to Amazon or other mainstream platforms.
Even if certain marketplaces generate smaller portions of revenue, MerchantSpring allows you to monitor them alongside your main sales channels.
For example, a seller operating on Amazon UK and looking to launch on eBay Germany can simply connect both accounts to MerchantSpring.
From then on, all data from both platforms is shown together in one place.
This removes the need to switch between Seller Central, eBay dashboards, and spreadsheets.
The Time-Saving Advantage
One of the biggest benefits sellers and agencies report is how much time they save with centralized reporting.
Normally, users spend hours manually downloading reports from multiple platforms, cleaning data, and creating Google Sheets dashboards.
With MerchantSpring, these processes are eliminated.
Most sellers spend around two hours every Monday just compiling performance metrics.
With MerchantSpring, this same analysis can be completed in 15 minutes or less.
That’s because all your data is automatically synced, calculated, and visualized for you across all marketplaces.
MerchantSpring Dashboard
Once your accounts are connected, you’ll land in the main dashboard.
This is the core of the MerchantSpring interface.
It gives you a full overview of your sales and performance data across all marketplaces and ad platforms in one place.
You no longer need to jump between Amazon Seller Central, eBay reports, Walmart dashboards, or spreadsheets.
Everything flows into one interface automatically.
The dashboard shows you:
Sales performance
Profit and loss
Marketplace-specific performance
Ad campaign results
Purchase order activity and trends
For example, if you're selling the same product across Amazon, eBay, and Walmart, you’ll see all the performance data for that SKU in one consolidated view.
This means you can compare how it’s doing per channel instantly.
No manual pulling or matching of reports needed.
The dashboard is especially useful for agencies managing multiple brands.
It allows you to pull in all accounts and view their data side by side.
To put it into perspective, MerchantSpring clients include agencies working with over 250 different brands.
Dashboard Customization Options
Now, at the top of the dashboard, you'll find customizable settings that let you control how the data is displayed.
These include:
Date Range Filters: Choose the time period you want to analyze, such as the current month, last month, or any custom range.
Comparison Periods: Compare your performance to a previous period, for example, this month versus last month, or this year versus last year.
Timezone Settings: Adjust the dashboard to reflect your local timezone. For example, if the account uses Australian Eastern Daylight Time and you want it set to Pacific Standard Time, you can make that change easily.
Currency Display: Choose the currency you'd like to view metrics in. This is essential for international sellers who need to track performance in USD, GBP, EUR, or others.
Tagging and Account Organization
Another major advantage of the dashboard is the tagging system, especially helpful for agencies or anyone managing multiple seller accounts.
You can assign custom tags to any connected account.
This might be:
A specific marketplace like “eBay Accounts”
A regional tag like “European Amazon”
A client-specific tag like “Luke’s Brands”
These tags make navigating between accounts much easier.
Instead of sifting through hundreds of brands or accounts, you can group and filter them by tag to find what you need quickly.
For agencies and portfolio managers, this significantly reduces the complexity of account management.
My Channels
Next to the dashboard is the My Channels section.
This is where you move from the high-level dashboard into detailed channel-specific analytics.
It's designed for deeper visibility and is especially useful for performance reviews, product insights, and ongoing account optimization.
In the demo walkthrough, we use a 3P (third-party) Amazon US Seller account.
However, MerchantSpring also supports 1P (first-party) Amazon accounts, so both seller types can use this section fully.
My Channels Side Menu
On the left-hand side of the screen, you’ll see a vertical menu.
This menu lists all the available metric categories inside the My Channels section.
Each category is made up of more specific and detailed metrics as you scroll down.
For new users, this layout might seem a bit overwhelming at first, but there’s a helpful way to think about it.
Picture the menu like a funnel.
At the top, you’ll find broad overviews.
For example, in the Sales Insights category (we'll talk about it later in the guide), the first few reports show high-level data like:
Sales by category
Sales by country
Sales by brand
As you move down the list, the insights get more detailed.
You’ll eventually see metrics that show your best- and worst-performing products, sales targets, and other granular data.
This top-to-bottom structure makes it easy to go from a wide view of your business to very specific insights.
Channel Overview
The first part of the My Channels section includes a Channel Overview, where you can view key customer metrics like:
Traffic and conversion rates
Lifetime value
Purchase behavior
Cancellations and refunds
Here's a deep dive into each of these customer metrics:
Traffic and Conversion Metrics
One of the most used and valuable areas inside My Channels is the Traffic and Conversion section.
This is especially popular among sellers who want to optimize listing performance and understand shopper behavior.
When you click into Traffic and Conversion, you’ll be able to view:
Page views vs. sessions
Browser vs. mobile traffic splits
Conversion rates by product
Graphs visualizing changes over time
You can also filter these metrics by date range, comparison period, and page type just like on the main dashboard.
For example, switching from this month to last month will automatically adjust the displayed data throughout this section.
There’s also support for parent vs. child ASIN views, letting you break down performance for variations of the same product.
The interface is flexible.
If certain metrics aren’t useful to you, they can be removed for a cleaner layout.
You can also add extra data points if you want a more complete view.
This customization allows you to shape the workspace around your preferences (whether you prefer simplicity or a fully detailed analytics board).
Lifetime Value
Inside the My Channels area, you can also analyze Customer Lifetime Value (CLV).
This section helps you understand how much value you're getting from repeat customers over time.
MerchantSpring uses a cohort-based methodology, which means it groups customers based on when they made their first purchase and then tracks their behavior afterward.
This is especially useful for Subscribe & Save products or those that show repeat buying behavior.
For example, if you're selling consumables, supplements, or personal care products, this feature helps you measure:
How successful your customer retention is,
Where to allocate advertising budget,
Which products to promote, and
How to structure your offers.
If you can see that certain products bring back more repeat buyers, you may choose to invest more in those listings or channels.
The demo walkthrough is based on a 3P Amazon US account, the data shown may have gaps or incomplete metrics.
That's why MerchantSpring recommends connecting your own live accounts to get accurate insights.
Repeat Purchases
The next metric in the Customers category is Repeat Purchases.
This one is closely tied to CLV but provides a more product-level view.
It shows:
The original purchase date,
Whether the same customer made another purchase later,
Sales volume for both new and repeat customers, and
Total customer value over time.
In the demo walkthrough, no repeat purchases are shown, but in a live account, you would be able to identify which SKUs are driving return buyers and how often those second purchases happen.
Now, to clarify, “Sales” in this section refers to the volume sold on a specific day.
“Repeat,” on the other hand, indicates whether any of those sales came from customers who had previously purchased.
So, if a customer made their first purchase two weeks ago and bought again today, that would appear under the “Repeat” column for today.
The layout and features are similar across most supported marketplaces.
For example, if you're using MerchantSpring with eBay Germany, you’ll see a similar repeat purchase dashboard.
However, some smaller or niche channels may have limited data availability depending on what’s accessible via the channel’s API.
If you're unsure whether your platform is supported, the best step is to contact MerchantSpring support directly.
Their team typically responds quickly and can confirm whether your marketplace is covered.
There are also built-in tools and external resources that show supported regions and platforms by area such as South America, Oceania, Europe, and North America.
The Repeat Purchases section also allows you to dig deeper into repeat behavior by product.
This view shows which products are frequently bought first and what items are most often purchased afterward.
It also includes the average number of days between purchases, giving you a clearer sense of timing and buyer patterns.
For example, in the demo walkthrough, you'll notice that the first product purchased is a finishing touch flawless perfume.
And the second most common follow-up product is an eye shadow cream labeled “101.”
With this insight, you can begin to ask questions like:
Are we investing ad spend into these products?
Should we be promoting this second item more heavily because it’s often the next step in a customer’s purchase journey?
Generally, this type of data helps brands make more informed, data-driven decisions rather than guessing based on past sales reports.
Instead of treating each purchase as separate, you begin to see patterns in how people shop, and which products bring them back.
As you analyze this view, you can switch the date range and comparison period to better match your strategy.
For example, viewing current quarter vs. last quarter gives a more recent lens on shifting customer behaviors.
Next up, below the purchase behavior, the lower part of the page shows the customer purchase path.
It shows you the flow.
For instance, a customer buys one item first, then on average, say 18 days later, comes back and purchases another product.
This doesn’t mean it happens in the same session, but rather over time.
If enough people follow the same path, that tells you something valuable about your catalog and how products work together.
Accordingly,
You can offer a virtual bundle of these products on your listing.
You might consider creating a physical bundle, though that takes more planning and inventory management.
Or you can update your listing content or cross-sell strategy. For example, by adding a recommendation like “Customers who bought this also love…” with the proven second item.
This kind of metric is also useful in advertising decisions.
If you know a certain product tends to follow a specific first purchase, you can retarget customers with that second item or include it in “Frequently Bought Together” ad strategies.
It all starts with the data.
By connecting your real accounts, whether you're selling via Amazon 3P, 1P, or other supported marketplaces, you'll be able to see exactly which products are creating repeat business and how to use that insight to drive growth.
Subscribe and Save
After Repeat Purchases, you'll find a specific section for Subscribe & Save metrics.
As the name suggests, this section shows how your subscription-based products are performing.
This is especially relevant for Amazon sellers using the Subscribe & Save feature, where customers opt to receive a product regularly (e.g., monthly) at a discount; typically 5–10% off.
It’s commonly used with consumables like supplements, food items, or personal care products.
In MerchantSpring, you can track how well your subscription offers are converting and generating recurring revenue.
You’ll see:
Total number of subscribers per product
Revenue from subscribers
Average revenue per subscriber
Non-delivery counts and flags
These metrics help you quickly identify which subscription products are delivering real value.
For example, a product might show a high revenue per subscriber, but if only one person is subscribed, that data needs to be read in context.
It gives you a clearer view of how scalable that success is and whether to invest further into subscription campaigns or product positioning.
These insights are visible per product, and if you’re managing multiple brands or marketplaces, you can monitor them separately by tag, channel, or region.
No matter if you're a solo seller or running an entire agency, this type of data allows you to track performance without needing to check each product page manually.
Cancellations and Refunds
The last section under this category is Cancellations and Refunds.
It gives you a clear, focused view of products that are being returned or canceled more often than others.
This is especially helpful for agencies and brand managers who need to respond quickly when clients or internal teams flag potential issues.
By spotting high-return items early, you can take proactive steps before problems arise or start affecting broader performance.
You can also download this view as a report whenever needed.
In fact, all sections here are fully downloadable.
So, you can easily export reports, jump on a client call, and walk through the numbers in a clean, visual format.
That kind of transparency builds trust and helps both sides get to the root of issues without relying on assumptions.
For example, if one SKU shows a spike in refunds, it’s a clear signal to dig deeper.
Is there a product defect?
A listing miscommunication?
Shipping-related damage?
These insights help you narrow down the cause and take targeted action.
Sales Insights
Next to the Customers category is Sales Insights.
This section allows you to break down your performance across various metrics.
Sales by Category
The first one is Sales by Category, which shows how products are performing based on their assigned Amazon listing category.
For example, if you sell products like shampoos, facial lotions, and skincare supplements, each item will be grouped according to its listing category.
So even if all your products fall under the broader “Personal Care” umbrella, their results will be segmented based on how they’re specifically categorized in Amazon (e.g., Hair Care, Skin Care, Vitamins & Supplements).
Sales by Country
Next, there's Sales by Country, which helps you understand which regions your orders are coming from.
In the demo walk through, the store is based in the US, so most purchases show from America.
But for sellers operating in Europe or globally, this view helps highlight unexpected markets, like Finland, that might be worth exploring further.
Sales by Brand
Next, Sales by Brand gives you a performance breakdown if you manage multiple brands under one account.
You’ll see which brand names are driving the most revenue and how they compare across channels.
Sales by Group
In the Sales by Group section of MerchantSpring, sellers can organize ASINs into custom groups to simplify performance tracking.
This is especially useful for sellers with large catalogs or product lines that include multiple variations under the same general category.
For example, imagine you own a lipstick brand with 1,000 shades, and out of those, 100 are variations of red.
Now, you just want to see how your “Cherry Red” lipsticks are performing.
That's not every single red shade, but just five ASINs that represent this specific tone.
Sales by Group lets you do so easily.
You can create a group around any set of products, by type or by brand, and then view consolidated performance data for that group alone.
This allows you to focus on what matters instead of getting lost in the noise of a large catalog.
Another practical example is with seasonal or themed products.
If you sell birthday cards, you might have categories like "Birthday Cards for Her," "Birthday Cards for Him," or "Christmas Cards."
During the holiday season, all you may care about is how your Christmas card ASINs are doing.
So you’d group together listings like Santa cards, elf cards, reindeer themes, etc., and view them as one unit.
This isolates performance and helps you optimize more effectively for that season.
The Sales by Group section becomes especially valuable for sellers managing dozens or hundreds of ASINs.
It helps cut through the clutter and gives you a focused performance view across multiple listings with similar characteristics.
You can also apply this logic across categories, product use cases, or even listing types.
For instance, if you’re selling brushes, some for clothes and others for walls, and you have 100 total brush ASINs, grouping them by use lets you compare broader performance.
Instead of assuming your wall brushes are top-performers based on a few good ASINs, you might discover that your clothing brush category actually drives 70% of the volume.
That insight isn’t always visible without grouping, but it can shape future product development and marketing strategies.
The same applies to brands.
If you manage several brands that all sell the same product type, like lipsticks, you can group by lipstick across all brands and compare performance at that level.
This saves a massive amount of time and offers a bird’s-eye view of how each segment is really doing.
Now, when it comes to creating these groups, there are two methods:
Manual Click-and-Add: Select ASINs directly within the interface.
CSV Upload: For larger group creation, you can download a template CSV file, add your ASINs offline, and upload them back into the system. This method speeds up the process if you’re grouping dozens or hundreds of items at once.
If you’re managing hundreds of products, this is one of the most powerful and time-saving tools inside MerchantSpring.
It simplifies analysis, supports strategic planning, and helps make decisions that are grounded in clear, segmented performance data.
Sales by Product
The Sales by Product view shows performance broken down by SKU or ASIN.
You’ll see data by brand, category, price, and units sold.
The display is customizable.
You can remove or add columns depending on whether you want a simplified view (like just TACoS or ACoS), or a deep dive that includes every metric available.
Sales by Parent
You can also view Sales by Parent, which rolls up performance at the parent product level.
This helps when comparing listings that have multiple child variations under one umbrella, like different sizes or colors of the same item.
Top and Worst Sellers
These metrics let you instantly identify what’s driving the most revenue (and what isn’t).
You can add more data columns as needed for context like impressions, clicks, or revenue.
Sales Targets
This metric allows you to track actual sales against your pre-set goals, whether by product, brand, or marketplace.
It’s a quick way to see how close you are to hitting targets and where you may need to adjust strategy.
Profitability
From there, you move into the Profitability category.
This is where MerchantSpring shows how much money your business actually keeps.
Instead of only showing sales, it pulls in product costs, Amazon fees, refunds, and ad spend, then calculates your real profit.
This helps you see whether a product or channel is truly making money, not just generating revenue.
Here's a breakdown of all the metrics in this category.
Channel Profit
This metric gives you a clean, easy-to-read overview of your Profit and Loss (P&L).
You can compare two different time periods side by side, such as this month vs. last month, or this quarter vs. the previous one.
Just select the desired date range and comparison period from the dropdown to update the report instantly.
At first glance, you’ll see a basic profit and loss summary, showing top-level figures like total sales, expenses, and profit.
If you want to go deeper, you can toggle on the Detailed P&L view for both time periods.
This breaks down your numbers into more granular expense categories and additional performance metrics, giving you a comprehensive view of profitability.
You can also track refunds and cancellations directly from this view, with that data pulled in automatically from your connected marketplaces.
However, there is one key input you need to provide: Cost of Goods Sold (COGS).
This isn’t pulled from Amazon or other platforms, so you’ll need to upload it manually.
MerchantSpring has made it easy with a CSV template you can fill out and upload.
Once your COGS is added, all profit metrics become more accurate, giving you a true picture of what you're earning per product, channel, or time period.
If needed, these reports can be downloaded.
While MerchantSpring is built to centralize your analytics, there’s always the option to export files
It's useful if you want to email them to stakeholders or save them for offline records.
Monthly Profit
Next up, the Monthly Profit view works similarly.
The layout is almost the same, but it breaks down your profitability on a month-by-month basis.
This is helpful for identifying trends, seasonality, or shifts in margin over time.
Product Profit
The Product Profit section gives a detailed breakdown of profitability at the SKU level.
You can view metrics like shipped product sales, refunds, reimbursements, promotions, and advertising costs all in one place.
This is also where you input your Cost of Goods Sold, either manually or through a bulk CSV upload.
Once added, MerchantSpring calculates product-level P&L, allowing you to analyze profitability per item with accuracy.
You can also download this report for sharing or internal use.
That wraps up everything you need to know about this section, so let’s move on to the next.
Channel Listings
This section gives you a unified view of your listings across all connected marketplaces.
Here’s a closer look at the key metrics that help you monitor their accuracy, visibility, and overall performance:
Content Change Alerts
This is one of the latest releases inside MerchantSpring.
It's currently in beta mode, which means it’s still being tested and improved based on user feedback.
If you try it and notice ways it could be more useful or accurate, you're encouraged to share your suggestions.
The MerchantSpring team actively builds off community input.
Now, the purpose of this feature is to help you monitor changes made to your product listings.
For example, imagine you're selling a lipstick and someone else, maybe another seller or a team member, changes the title, images, or bullet points.
This can happen without your knowledge, especially if you’re working with a large catalog or across multiple team members.
Even worse, changes made by mistake or by a competitor, can impact your listing performance.
In one real example, a seller had their product category changed without noticing.
They sold kids’ toys, but due to a category edit, their items ended up showing in the adult toys section.
Needless to say, that misplacement hurt their sales and caused confusion.
If they had been using Content Change Alerts at the time, the issue would have been caught and fixed early.
Here's a quick explanation of how this feature works:
When MerchantSpring detects a content change, it flags it immediately.
For example, if a product’s title was altered, you’ll see a notification showing exactly what was changed.
You can click into the change, view both the previous and updated values, and then choose how to act on it.
In the demo walkthrough, one example you'll see would be removing the word “silica” from a product title.
While this might seem minor, it could affect SEO, ranking, or conversion rate, especially if the removed keyword was essential to traffic or targeting.
This section helps you understand what changed, when it changed, and lets you quickly evaluate whether the update was harmless or needs to be reversed.
What makes it especially valuable is the centralized view.
You’re not expected to manually check each listing.
If you're managing dozens or hundreds of SKUs, there’s no way to spot these changes daily.
This feature catches the updates for you and flags them in one place.
It not only saves you time but also helps you avoid lost sales or listing issues caused by unapproved edits.
Content changes can actually happen for many reasons such as:
A team member updates the listing and forgets to inform others.
A supplier or third-party service modifies something unintentionally.
A competing seller with listing access pushes unwanted changes.
Sometimes, Amazon’s system itself seems to adjust content automatically or reset it based on previous data.
The change may also be regarding other metrics such as suppressed products and buy box performance changes.
However, no matter the cause, MerchantSpring ensures that it doesn't go unnoticed.
As soon as a change is detected, it not only appears in the Content Change Alerts section but also triggers an email notification from MerchantSpring.
That way, even if you're not actively logged into the platform, you're still alerted right away and can investigate.
Suppressed Products
Next is the Suppressed Products view, crucial for identifying listings that are no longer active due to suppression.
When you open this page and notice that it’s blank, it's actually a good sign.
It means none of your listings are currently suppressed.
When data does show up here, that’s when you know something needs your attention.
Suppression could happen for various reasons.
It could be missing attributes, policy violation, or listing quality issues.
If products are showing as suppressed, this section gives you an instant list so you can investigate and take action.
Again, this ties into the alerts system.
If a listing becomes suppressed, you can receive a notification so that you're not caught off guard and can act quickly to restore the listing before sales are impacted.
This is especially useful for agencies managing multiple clients or large sellers with hundreds of SKUs.
You can't manually check everything every day, but with these alert systems in place, you’ll be informed right away when there’s an issue.
Buy Box Performance
The Buy Box Performance feature is one of the most in-demand tools inside MerchantSpring, and for good reason.
Whether you're a brand, reseller, or agency, knowing when and why you’re losing the Buy Box can have a direct impact on your sales.
When you enter the Buy Box page, the first thing you'll see at the top is a quick summary that highlights:
Products where you're winning the Buy Box
Listings where you're losing
Cases where you're losing to Amazon itself
Instances where you’re losing to other sellers
This high-level view helps you immediately spot problem areas, and you can filter the data further based on what you want to focus on.
To dive deeper into a specific listing, you can click on any product row.
For example, if you're losing the Buy Box, you can quickly see who's winning it, their current price, and how it compares to yours.
In some cases, the difference may be as little as $1, which could explain the Buy Box loss.
You can also click directly into the product page from here to take action such as adjusting price, reviewing listing quality, or updating fulfillment settings.
Who Needs This Feature THE Most
While all Amazon sellers care about the Buy Box, the level of attention needed depends on your selling model.
For private label sellers, you usually control the listing and are the only seller.
In these cases, you’re unlikely to lose the Buy Box unless Amazon steps in or you violate pricing or shipping policies.
So while the feature is helpful for checking consistency, it may not need daily monitoring.
However, for wholesale, arbitrage, or reselling models, Buy Box performance is critical.
You're often sharing the listing with multiple sellers and competing constantly for visibility.
A single price change by a competitor can cause you to lose sales.
This is where MerchantSpring’s Buy Box tool becomes essential.
It supports sellers managing multiple listings across multiple brands; even large resellers handling hundreds or thousands of ASINs.
For some, Buy Box tracking is a full-time job.
There are sellers who dedicate entire teams to just monitoring Buy Box status, adjusting pricing, and trying to win back positions.
Use Cases Across Different Seller Types
The Buy Box Performance feature is used by a wide range of clients - from large brands to small resellers.
Some manage their own product lines, others are resellers of well-known products like electronics or beauty brands.
In both cases, Buy Box tracking helps maintain sales velocity and prevent revenue loss.
There are even brands who resell to others but want to keep the Buy Box on their own listings.
MerchantSpring helps them monitor if another seller takes over and lets them respond quickly.
For online arbitrage sellers, where inventory and pricing fluctuate constantly, this tool helps stay on top of changes.
You’ll know if you're winning, who you’re losing to, and why; all without having to check each ASIN manually.
This also connects back to pricing strategy.
If you notice you're consistently losing the Buy Box due to price differences, that may prompt you to rethink your pricing thresholds or fulfillment methods.
Operations
Next, MerchantSpring also offers a suite of operational metrics that help you manage store performance beyond just sales.
These include:
Account Health
The Account Health section in the Operations category gives you a snapshot of how your account is performing in areas like shipping, customer service, and policy compliance.
It’s a useful page to check, but it's not one that sellers typically monitor constantly since the data doesn’t update as frequently as some of the other sections.
You’ll be able to view whether there are any current performance concerns or compliance flags tied to your account.
These may include late shipment rates, customer response issues, or other seller performance metrics based on Amazon’s standards.
Overdue Orders
The next section inside Operations is the Orders Overdue feature.
Ideally, this page should remain empty because that means your orders are being fulfilled on time.
Overdue orders usually indicate that a customer placed an order with an expected shipping date, but the item hasn’t been shipped on time.
This is more common for FBM (Fulfilled by Merchant) sellers where the seller is responsible for handling fulfillment directly.
For Amazon FBA sellers, overdue shipping is generally handled by Amazon itself.
As an FBA seller, you wouldn’t normally have much visibility or responsibility for these issues.
However, for FBM sellers or those using a 3PL warehouse, this section becomes important.
It lets you see which orders are delayed, the value of those orders, and their destination, so you can step in and fix the issue before it escalates into a policy violation or negative review.
Now, another thing to note is, this view applies to Amazon marketplaces specifically.
Other platforms like eBay or Walmart may not appear in this section unless their APIs support similar tracking.
As mentioned earlier in the guide, each marketplace will have slightly different options based on what data is available through their system.
Review Management
MerchantSpring also allows you to manage product reviews more efficiently with its automated review request feature.
Instead of manually requesting reviews from customers one by one, the system can automatically send those requests after a purchase is made.
You can configure this automation to apply across FBA and FBM orders, and schedule it based on delivery date.
This feature helps ensure a consistent flow of feedback without extra effort, especially useful for sellers handling volume or managing multiple products across different fulfillment models.
Out of Stocks
Next is the Out of Stocks section.
Here, you’ll see a snapshot of all current and at-risk products.
This shows not only what’s already out of stock, but also gives insight into products that may run out soon based on recent sales trends.
For example, if a listing shows six units in stock and sales over the last 30 days were 54 units, MerchantSpring can estimate when the item may go out of stock and whether action is needed.
A clean, at-a-glance view makes it easier to track and respond to these risks before they impact sales.
FBA Inventory
The FBA Inventory section goes a step further.
This tool is built specifically for sellers using FBA, and it’s used heavily by high-volume sellers and brands that rely on Amazon for their logistics.
At the top of the page, there’s a Replenishment Configuration section.
This is where you input key data points like:
How long it takes to manufacture or reorder your products
How many days’ worth of stock you typically order
When you want to be alerted to restock
For example, if it takes 120 days to restock, and you aim to hold 90 days of coverage at any time, you can configure these numbers directly into the system.
Then, when your available inventory drops below your preset threshold, let’s say 20 days of coverage, MerchantSpring will alert you.
This helps prevent stockouts before they happen.
You can also view your daily sales rate, how much storage your products are using, and other critical logistics info.
This is particularly valuable for FBA sellers trying to manage their Amazon storage more efficiently.
And yes, you can create shipments directly from MerchantSpring.
Once you’ve logged into your connected Amazon account, you can start the shipment workflow without needing to switch over to Seller Central.
This saves time and keeps your process centralized.
In the Replenishment Configuration section, configuring your lead time helps you prevent surprises.
For example, let's say your products take a long time to produce or ship.
You can set accurate production and delivery windows here to provide proactive inventory alerts.
This helps avoid being caught off guard and allows you to respond early before inventory becomes a problem.
Another benefit of tracking inventory through MerchantSpring's FBA Inventory section is staying ahead of Amazon’s storage fee structure.
As many sellers know, Amazon’s FBA storage fees increase over time:
After 90 days, you start paying more.
After 180 or 270 days, the rates increase further.
After one year, long-term storage fees become much higher.
And recently, Amazon has introduced even more steps between those major time blocks, making storage management even more critical.
Without visibility, it's easy to overlook stock that’s aging in Amazon’s warehouses.
This can result in lower profits or even losses due to surprise charges.
Using FBA Inventory, you can spot when your stock is approaching a long-term fee threshold and take action.
That could mean running a limited-time promotion, bundling the product, or reducing the price just enough to clear the units before the penalty kicks in.
While Seller Central offers partial visibility into aging inventory, MerchantSpring brings that information front and center.
Seeing it clearly and in time lets you avoid unnecessary costs and keeps your margins intact.
The tool also gives you a sense of your storage volume cost, so you can see how much that inventory is costing your business month by month.
It helps balance the equation - not too much stock sitting idle, but also not too little to stay in stock.
Marketing
From there, the next section is Marketing, which follows the same funnel structure you’ve seen in earlier features like Sales Insights and Profitability.
Marketing Overview
The top-most metric is Market Overview, designed to give you a quick snapshot of your overall advertising performance.
It helps you spot what’s working and what’s not without diving into each campaign manually.
All your summary-level data is visible in one place, and from there, you can easily move into more detailed sections for deeper insights.
Campaigns by Group
This section works exactly like grouping in sales data.
If you remember earlier in the guide where lipsticks and holiday cards were grouped for performance analysis, the same logic applies here.
Let’s say you're running multiple campaigns around oral care.
You can group them together to see exactly how those ads are performing as a segment.
Within that group, you can view whether campaigns are active, how much they’re spending, your advertising cost of sale (ACoS), impressions, clicks, click-through rate (CTR), conversion rates, and order volume.
You also get the campaign start date and all the core performance metrics you'd expect.
Campaigns
Moving into Campaigns, you can see the individual campaign view, which pulls you further into the specific ad structure.
Ad groups
Campaigns flow directly into Ad Groups, where you can view how grouped ad sets such as those under oral care are performing in terms of impressions, clicks, etc.
Products
From there, the next layer is Products.
This view shows how each advertised product is performing, letting you compare spend and return at the SKU level.
You can see what’s delivering conversions and what might be underperforming in terms of efficiency or cost.
Product Ads
Then you have Product Ads, which shows ad status and metrics like CTR, total clicks, and performance across active promotions tied to individual items.
Keywords
After ads, comes Keywords, a crucial area for anyone actively managing PPC campaigns.
In the Keywords section, you can track which keywords are getting the most spend and whether that spend is delivering results.
If you're investing heavily in certain terms, you want to make sure they're driving clicks and conversions, not just impressions.
This whole area functions as a PPC reporting suite, designed to move you from a bird’s-eye view down to the keyword level.
If you're managing campaigns across different products, brands, or clients, it gives you the structure to evaluate what's working and what isn't with actionable insight.
When it comes to optimization, this tool is especially helpful for agencies managing multiple brands.
You can go in, check keyword performance, identify where spend is too high, or see where a keyword is performing well and deserves more budget.
From there, your team can adjust bids, reallocate budget, or shift focus just like a dedicated PPC manager would, but within a centralized view.
One last thing to cover before wrapping up this category, the Marketing section also lets you set up alerts.
This is where you manage how the platform notifies you or your team when key events occur.
To access it, click the bell icon in the top-right corner to open the Notification Center.
From there, go to Settings in the left-hand menu, where you can create new alerts and set notification rules for each channel individually.
For example, you might want to get an email every time you lose the Buy Box.
You can set that alert to trigger immediately.
You can also set alerts for suppressed listings, low inventory, content changes, etc.
If you're keeping an eye on stock levels, you can set your own rules for how many days of inventory you want to keep on hand.
For example, if stock drops below 10 days’ worth, you’ll get a notification right away.
The Marketing Overview section also displays a summary of active alerts, allowing you to take action right from that screen.
One thing to note though: the system won’t consider an alert resolved until you manually mark it as resolved.
This is intentional.
Many times, we get a notification, click it, then get distracted, and the issue slips through the cracks.
MerchantSpring’s approach helps prevent that.
It requires you to confirm that something’s been handled before it clears, adding a layer of accountability.
This setup is especially useful if you're managing a team.
It ensures everyone is on the same page and that nothing gets overlooked.
Whether you’re working with internal staff, clients, or outsourced support, these alerts provide a consistent way to track what’s being handled, and what’s still pending.
Reports
Next up is Reports, the third and final core module of MerchantSpring, following the Dashboard and My Channels sections.
This section is one of the most powerful parts of MerchantSpring, especially for agencies, brands, and sellers who need regular reporting without spending hours pulling data.
Agencies often need to send performance reports to clients.
Brands rely on updates to keep management informed.
And sellers may want weekly reports during busy seasons and monthly summaries the rest of the year.
MerchantSpring is built to solve exactly that problem.
You can create both single-channel and multi-channel reports, depending on what you want to track and who the report is for.
This is where tags become extremely useful.
Earlier in the platform, channels were tagged to make navigation easier.
Here, those same tags allow you to group channels into one report.
For example, if you sell across multiple marketplaces in Europe but only want to report on Amazon data, you can tag Amazon UK, Amazon Germany, Amazon France, and others, then include only those in a single multi-channel report.
Or, if you're an agency managing 10 or 15 brands, you can group those client accounts together and generate one consolidated report that shows how all of them are performing.
Once the channels are selected, you can set how often the report is sent.
This could be weekly, monthly, or aligned with a specific time period.
You can also choose the reporting window and the comparison timeline, such as this period vs. the last period.
There are additional configuration options as well.
For example, you can enable CSV downloads, choose the currency, and fine-tune other settings depending on how the report will be used.
After that, building the report itself is straightforward.
The interface works in a drag-and-drop style, allowing you to select exactly what data you want included.
You can pull in sales insights, profitability data, and other key metrics across the selected channels.
You can make the report as simple or as detailed as you want.
Some teams prefer a clean, high-level overview.
Others want a more comprehensive breakdown that includes deeper performance metrics.
MerchantSpring supports both approaches.
Once everything is configured, you generate the report and set it to run automatically.
When you open a generated report, you’ll see a fully structured document that includes:
The reporting period and comparison period
Time zone information
Performance summaries
Data sections based on what you selected
At the top of the report, you’ll also notice automated insights, which are part of MerchantSpring’s AI integration.
These sections highlight key observations and suggest possible next steps based on the data.
Below that, the report breaks down into the specific performance areas you chose.
This could include sales trends, profitability comparisons, and other metrics relevant to your business.
The reports are interactive, meaning you can review current performance alongside previous periods, year-over-year comparisons, or prior months, depending on how you set it up.
Because these reports are sent automatically, they reduce thed to log into the platform constantly.
Instead of spending time pulling data manually, you receive consistent updates that let you stay informed while focusing on execution.
Automated reports are especially valuable during high-traffic periods like Black Friday, Cyber Monday, or the holiday season.
During these times, teams often want frequent updates on specific products or campaigns.
For example, if you want to monitor how one product is performing during a promotion, you can build a report focused on that product and have it sent regularly.
This keeps you laser-focused without needing to dig through dashboards daily.
They’re also useful for accountability.
Agencies can send reports to clients.
Brands can receive structured updates from account managers.
Stakeholders higher up the chain can see how different brands or channels are performing without needing platform access.
On the other side, brands can also use these reports to hold agencies accountable by clearly tracking performance trends over time.
Everything is configurable.
You decide what data is included, how often it’s delivered, and who receives it.
Once set up, the system runs in the background.
White Labeling with MerchantSpring
One of the standout features that sets MerchantSpring apart is its ability to be fully white-labeled.
That means customizing the look and feel of the dashboard to reflect your own branding or even your client’s branding rather than MerchantSpring’s default visuals.
If your brand colors are orange and green, those can be reflected in the dashboard.
Your logo can replace MerchantSpring’s, giving you a branded experience that feels native to your organization.
And it goes beyond just the visuals.
For large agencies working with high-profile clients, it's even possible to have separate login instances that are customized per client.
This way, clients log in and see their own logo and colors, creating a more tailored and premium experience.
These kinds of customizations can be discussed further in the pricing section of the platform, which may include white labeling as part of a specific plan or tier.
By this point, most of the key areas have been explored; the dashboard, channels, alerts, reports, and performance analytics.
However, there are still a few remaining elements worth highlighting, particularly Vendor Central, which serves a different type of Amazon seller compared to Seller Central.
Vendor Overview
So far, we’ve focused on the seller side of things; primarily Amazon Seller Central (3P) accounts.
But MerchantSpring also supports Amazon Vendor Central (1P) accounts, which are typically used by manufacturers or large brands that sell directly to Amazon.
This opens a different set of metrics and operational workflows.
Retail Analytics
The Vendor environment covers many of the same performance metrics as the seller side, but it also includes additional views tailored to Vendor Central.
One of the first areas you’ll explore is Retail Analytics, where you can track key figures like ordered revenue and shipped revenue.
These metrics can be viewed from both a manufacturing and a sourcing perspective.
Like in Seller Central, you can group products, dive into individual product performance, and explore sourcing data such as source share, lost POS, and exported COGS.
Lost POS, by the way, refers to missed purchase orders or potential revenue that wasn’t captured.
It's sometimes also referred to as the lost cost of goods sold.
The side menu in Retail Analytics follows the same funnel-like structure as the Seller Central; starting broad and narrowing down.
However, the terms and structure are tailored to how Vendor Central works.
As you scroll further, you’ll come across metrics like inventory health, subscribe and save, and revenue targets.
Purchase Orders
Another unique feature for Vendor Central users is Purchase Orders.
Inside this view, you’ll find a quick snapshot of purchase order statuses.
For example, what’s been submitted, what’s been accepted, what’s been received, and what’s been cancelled…
You can also toggle between different visualizations (bar charts or line charts) depending on how you prefer to read your data.
The results may take a few seconds to load, however, the structure and insights are clear and usable.
In addition to POs, you can view units sold, average order values, and categories like most ordered and least ordered products.
This allows for easy detection of underperformers or seasonal bestsellers.
Profitability
The next category is Profitability.
This section in Vendor Central is also similar to Seller Central but includes additional layers tailored to vendor-specific needs.
For example, it lets you explore both sell-in and sell-out metrics.
These help distinguish between the products you've sold to Amazon versus what Amazon has sold to end customers.
Another important metric is Profit By Vendor Code, which is highly useful for large vendors managing multiple supplier codes or business units.
This segmentation lets you monitor performance at a granular operational level.
Additional Features Similar to Seller Central
Vendor accounts also benefit from features like content change alerts and marketing campaign data, just like Seller accounts.
Though some data sources differ due to API limitations, the overall experience is cohesive and aligned across account types.
In fact, MerchantSpring is one of the few tools on the market that offers strong Vendor Central support.
Many analytics platforms focus only on Seller Central, but MerchantSpring stands out by offering solid tools for both types of Amazon businesses.
eBay Seller View and Multi-Marketplace Flexibility
The demo account also allows you to switch between different marketplaces.
For instance, if you’re selling on eBay, you can select your eBay account from the “Select a Channel” dropdown in the top-right corner and instantly access all your performance metrics within the same interface.
In the demo walkthrough, we switch to an eBay UK scenario.
From here, you’ll see available insights like customer lifetime value, repeat purchases, cancellations, and refunds, much like the Amazon view.
You’ll also get sales insights and some channel-specific tools.
For example, listing quality and item specifics, which are more tailored to eBay’s structure.
Operational elements are still there, but what you can access or display depends on what eBay’s API makes available.
That’s an important point: some marketplace features will differ slightly based on what data integration is permitted.
But overall, most key functionality remains consistent, whether you're working with eBay, Amazon, or others.
Useful Tips for Sellers Exploring MerchantSpring
If you're using a different sales channel altogether and you're unsure about support, there are a few options.
1 - You can drop a question in the comment section of the demo walkthrough this guide is based on (Quick Access: MerchantSpring Demo Walkthrough), or
2 - Reach out directly through the support chat on the MerchantSpring website.
Also, don't forget to explore the free MerchantSpring Academy course.
It’s a free training resource bundled with the platform that not only walks you through the software itself but also acts as a bit of a business improvement course.
It explains not just what the metrics are but how to think about them strategically.
Whether you’re managing your own store or working on behalf of clients, it’s a solid, helpful resource to go through.
Now, at this point, the walkthrough has covered almost every major area: the dashboard, channels, sales data, marketing performance, alerts, and reports.
Before transitioning into pricing, there’s just one last area left to explore: how to add a new channel to your MerchantSpring workspace.
Adding a Channel
To add a channel, go to the top navigation bar and select “Add a Channel.”
You’ll then choose between either an eCommerce channel or an advertising channel.
Some common options are featured at the top for quick access, but you can also search through the full directory to find a specific one.
Whether you're selling on TikTok, Wayfair, Shopify, or another marketplace, chances are it’s already supported on the platform.
MerchantSpring supports over 160 channels, so sellers and agencies with diverse portfolios are very well covered.
Once you select the channel, you’ll be guided through the connection process.
Usually, this involves validating your credentials or generating an API token from the selling platform you’re integrating with.
After connection, MerchantSpring begins pulling in data automatically.
How Long Does the Data Take?
It's important to know that data syncing does take time, especially if you have a high volume of products or historical records.
Don’t be surprised if it doesn’t populate instantly.
This isn’t a flaw; it’s just how data fetching works.
Modern users often expect instant results, but with multiple APIs in play and lots of back-end processing, it’s natural that full data loading can take a bit longer.
If you ever feel like it’s taking more time than expected, you can always message the support team through the MerchantSpring platform.
Most of the time, it’s just part of the normal sync delay, but the team is there to help if something truly seems off.
MerchantSpring Pricing Overview
Let’s now jump into the pricing section to get a clear picture of how much MerchantSpring costs across different use cases.
Pricing is structured by business type; whether you're a brand, manufacturer, agency, or service provider.
Pricing for Brands and Manufacturers
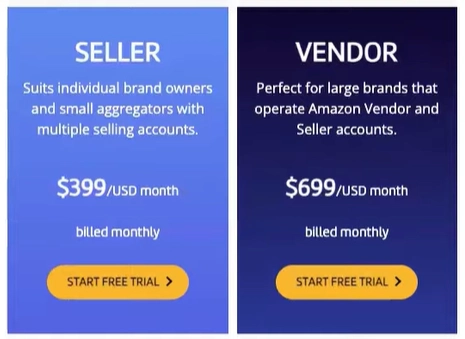
Pricing for Brands and Manufacturers is designed for most Amazon and eCommerce sellers.
Whether you're operating through Amazon Seller Central (3P) or Vendor Central (1P), this is the plan you'll want to explore.
It’s ideal for sellers managing their own accounts across multiple channels, like Amazon US, UK, Germany, eBay, or Walmart, offering both scalability and centralized insights.
And for 1P vendors working directly with Amazon, this tier includes the tools and features tailored specifically to the vendor environment.
The pricing shown in the screenshot above reflects the annual rate, which gives you a 20% discount for committing to a yearly plan.
For many users, this becomes a smart move once you’re confident that MerchantSpring works well for your business.
On the other hand, if you're just getting started or testing the waters, the monthly plan is a great way to begin without a long-term commitment.
Some users go monthly for a few months, confirm the tool’s value, and then switch over to annual to save over time.
Others know from the start they’re in it for the long term and go straight to the annual plan, especially when there’s a discount or promo code involved.
The pricing tables show you both Seller and Vendor options.
For instance, the Seller tier is meant for individual brand owners, small aggregators, and multi-account sellers.
Meanwhile, the Vendor Pro option is best suited for large brands that operate on both Seller Central and Vendor Central.
If you’re using the $699/month plan, for example, but your needs slightly exceed the default (say you have 16 channels instead of the 10 included), the team at MerchantSpring is open to tailoring your plan.
This isn’t a rigid pricing model.
You’re dealing with real people who want to make the software fit your business, not the other way around.
Monthly vs. Annual Options
Starting with a monthly plan is a common approach.
Try the platform for a few months, see how it integrates into your workflow, and then move to annual when it’s clear you’re going to stick with it.
MerchantSpring has very low churn, meaning once users adopt it, they tend to stay.
That speaks volumes about the utility and reliability of the platform.
What's Included?
As you scroll down the pricing page, you’ll see a feature breakdown that compares what’s included across different plans.
You’ll see key info like:
How far back your initial data sync will go (e.g., 3 months vs. 15 months),
Whether Vendor Analytics is included,
Access to modules like advertising reports, inventory planning, and more.
This comparison makes it easy to weigh the value of each plan and see what fits your current needs.
If a feature name is unclear like inventory planning, for example, it’s likely already been explained in the tutorial.
But if it’s still unclear, just check out the MerchantSpring Academy or reach out via the support chat on the site.
You’ll get quick answers and clarity before making any purchase decision.
The goal is for you to make a well-informed investment, not just a hopeful one.
The more confident you are in how the tool will help your business grow, the more valuable it becomes; and the happier you'll be with the return.
Whether it’s Seller or Vendor, monthly or annual, the pricing is set up to grow with you.
And if you hit a wall, whether it’s channel limits or something else, talk to the MerchantSpring team.
They’re open to making adjustments where possible, and they also understand the cost of building and maintaining a serious tool like this.
So it’s all about creating win-win relationships.
Pricing for Agencies and Service Providers
Just below the standard Seller and Vendor plans, you’ll find MerchantSpring’s pricing options for marketing agencies and service providers.
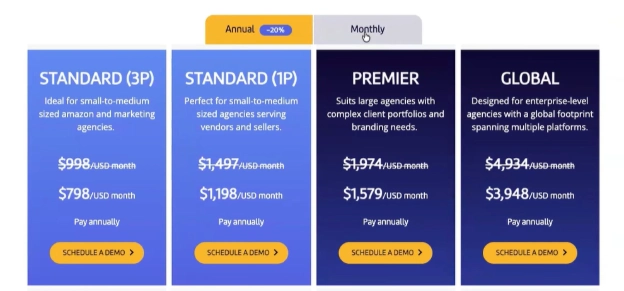
This section is designed for those managing multiple client accounts, and the structure is flexible enough to handle the variety that comes with agency work.
There isn’t one strict definition of what qualifies as an agency, so MerchantSpring breaks this down across tiers depending on your size, scope, and client type.
If you’re just starting out with a small number of clients, you’ll likely fall into the base-level agency tier.
This gives you access to over 50 connected channels, which is more than enough for most small-to-mid-sized operations.
If you’re a larger or global agency working with dozens or even hundreds of clients, you’d look toward the premium tiers.
These include added features such as white labeling, where your clients log into what looks like your agency-branded platform.
You can customize the colors, logos, and interface; creating a seamless, branded experience for your clients without them knowing MerchantSpring is behind the scenes.
On the lower end, smaller agencies that don’t have Vendor Central clients or don’t need white labeling can operate comfortably on the entry-level plan.
If you need to support some 1P Amazon vendors but you’re not yet managing dozens of accounts, there's also a middle tier to cover that space.
Then for the fully scaled, multi-market agencies managing complex portfolios and offering white-labeled access, the premium end is a better fit.
Each agency tier includes its own set of features, which you can review directly on the pricing page.
For example, the difference might include how many users can access the platform, how many channels are supported, or whether features like AI insights or report customization are unlocked.
MerchantSpring Free Demo and Trial Access
If you're unsure about which plan to choose, feel free to book a demo.
Use this demo to ask specific questions. I also welcome you to mention the coupon code VOVA10 to get 10% discount on your MerchantSpring plans. Good savings!
Whether it’s about integrations, use cases, or account setup, come prepared with a list of what you need to know.
The MerchantSpring team will walk you through everything and tailor the conversation to your situation.
This is a no-cost, no-pressure way to evaluate if the platform is a good fit.
Beyond the demo, there’s also a free trial.
You can connect your own accounts and start testing the platform before committing.
This lets you explore all the dashboards, reporting, advertising data, and alerts in the context of your real business, not just the demo environment.
It’s like test-driving a car before buying it.
MerchantSpring’s approach is simple: if the tool is right for you, they’ll help you make the most of it.
If it’s not the right time or not the right fit, there’s no hard sell.
The platform is designed to grow with serious sellers and agencies.
So if you’re not quite there yet, no harm; when the time comes, it’ll be ready for you.
The whole goal here is to help businesses grow through better data visibility, less time spent on manual reporting, and smarter decisions.
If that matches your direction, then MerchantSpring is worth exploring.
If not now, maybe later.
Either way, the demo and trial options give you a risk-free way to decide.
Release Notes
Sellers often reach out to the MerchantSpring team with questions like, “What’s coming next?” or “What new features are in the pipeline?”
To answer that, MerchantSpring provides detailed release notes accessible directly within the platform.
This helps users stay informed about ongoing updates, new features, and system enhancements.
Recent updates have included:
Amazon Attribution reporting improvements
AI Management System updates
Marketplace Content Profile (MCP) expansion
And most recently, integrations with tools like ChatGPT and Claude, allowing you to extract real-time account insights through simple questions
For example, sellers can now use AI to query their data conversationally, asking questions like, “How did our best sellers perform this week?” without needing to dig through charts manually.
This is ideal for operators who want speed and simplicity, especially those working across multiple time zones or juggling many brands.
The release log shows updates rolling out frequently.
Each monthly entry reflects continued platform improvements whether it's performance enhancements, new analytics modules, or partner integrations.
Users are encouraged to check this area regularly.
Or, as a busy seller or agency, here's what you can do: take the full release log and drop it into your preferred AI tool to summarize what’s most relevant for your business model.
This allows you to stay ahead of changes and identify the features most applicable to your operations.
Final Words
To wrap up, MerchantSpring isn’t a one-size-fits-all solution.
It’s built to be adaptable.
And if you're using it the way it was designed (streamlining operations, automating reporting, improving P&L visibility, managing advertising, avoiding stock issues) it can bring significant clarity to your business.
The demo is highly recommended for anyone still unsure about fit.
It's also useful if you need to clarify how your specific business model would be supported.
Plus, if there’s something this walkthrough didn’t cover clearly, the demo gives you the space to ask.
The trial is available as well.
You can link your own sales channels, sync your data, and test the tool before committing.
This ensures you're investing in something that aligns with your workflows.
If you’ve followed this entire walkthrough, you now understand how to use MerchantSpring’s:
Dashboard and performance analytics
Multi-channel reporting and profitability tools
Inventory and replenishment management
Advertising and keyword insights
Review automation, buy box tracking, and alerts
Reporting automation (including AI-generated reports)
Vendor Central (1P) support and white-labeled views for clients
And now, you’ve also seen how pricing works, and how to evaluate which plan is right for your team.
If this tool looks like a fit, go ahead and connect with the team, use the trial, or schedule a walkthrough.
Thanks for reading this full guide.
Wishing you continued growth in your Amazon or eCommerce journey.
P.S. This walkthrough was recorded together with Luke Lindsay from the MerchantSpring team, who did a fantastic job guiding us through the platform and sharing insights along the way.
Big thanks to him for making everything clear and easy to follow.
Also, a quick shoutout to Adina Nasri, my affiliate manager at MerchantSpring, for making this connection happen in the first place.
Partnerships like these really help bring you detailed demos and helpful content like this, so I truly appreciate the support behind the scenes.
Thanks again for tuning in, and I hope this guide helped you get a clearer picture of what MerchantSpring has to offer!
-
Getting Started with MerchantSpring
-
MerchantSpring Coupon Code
-
MerchantSpring Academy
-
The Main Areas of MerchantSpring
-
All-in-One Marketplace Connectivity
-
The Time-Saving Advantage
-
MerchantSpring Dashboard
- Dashboard Customization Options
- Tagging and Account Organization
-
My Channels
-
My Channels Side Menu
-
Channel Overview
- Traffic and Conversion Metrics
- Lifetime Value
- Repeat Purchases
- Subscribe and Save
- Cancellations and Refunds
-
Sales Insights
- Sales by Category
- Sales by Country
- Sales by Brand
- Sales by Group
- Sales by Product
- Sales by Parent
- Top and Worst Sellers
- Sales Targets
-
Profitability
- Channel Profit
- Monthly Profit
- Product Profit
-
Channel Listings
- Content Change Alerts
- Suppressed Products
-
Buy Box Performance
- Who Needs This Feature THE Most
- Use Cases Across Different Seller Types
-
Operations
- Account Health
- Overdue Orders
- Review Management
- Out of Stocks
- FBA Inventory
-
Marketing
- Marketing Overview
- Campaigns by Group
- Campaigns
- Ad groups
- Products
- Product Ads
- Keywords
-
Reports
-
White Labeling with MerchantSpring
-
Vendor Overview
- Retail Analytics
- Purchase Orders
- Profitability
- Additional Features Similar to Seller Central
-
eBay Seller View and Multi-Marketplace Flexibility
-
Useful Tips for Sellers Exploring MerchantSpring
-
Adding a Channel
-
How Long Does the Data Take?
-
MerchantSpring Pricing Overview
-
Pricing for Brands and Manufacturers
- Monthly vs. Annual Options
- What's Included?
-
Pricing for Agencies and Service Providers
-
MerchantSpring Free Demo and Trial Access
-
Release Notes
-
Final Words
Disclosure: Hi! It's Vova :) Some of the links in this article may be affiliate links. I get a commission if you purchase after clicking on the link, this does not cost you more money, and many times I can even get a nice discount for you. This helps me keep the content free forever. For you. Thank you! :)