Reports Tab in Sellerboard For Shopify: Quick Tutorial

If you’re using Sellerboard for Shopify, knowing how to navigate the Reports tab can make your life a lot easier.
This section lets you quickly download valuable data in spreadsheet format; whether it’s P&L reports by product, daily or monthly dashboards, or order lists.
In this short guide, I’ll walk you through what’s inside the Reports tab and how you can use it to analyze your Shopify store’s performance.
But before we begin, here's your chance to try Sellerboard for free:
Get Sellerboard 2 Month Extended Free Trial for Shopify
What’s Inside Sellerboard's Reports Tab?
Sellerboard's Reports tab is easily accessible through the side menu.
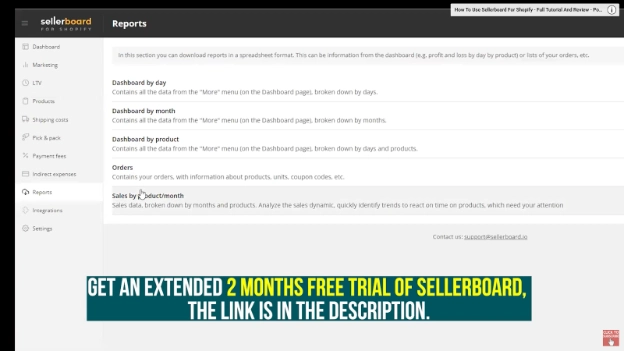
Here’s what you can access:
-
Dashboard by day - All your key data broken down by day.
-
Dashboard by month - Same as above, but summarized by month.
-
Dashboard by product - Performance insights by day and by product.
-
Orders - A full list of your orders, including product details, units, and coupon codes.
-
Sales by product/month - Analyze sales trends by product and month to quickly spot opportunities or issues.
This helps you track performance in detail and respond faster to changes in sales dynamics.
For a deeper dive, check out my full YouTube tutorial below and start your free trial today. No credit card required, all features included. 🙂
Or if you’d rather read, click here to access the full guide, written in an easy and conversational style: Learn How To Use Sellerboard For Shopify: A Full Tutorial
Get Sellerboard 2 Month Extended Free Trial for Shopify