How To Use Sellerboard For Shopify - Full Tutorial And Review - Powerful Shopify Analytics Software

-
Learn How to Use Sellerboard for Shopify
-
Introduction
- Meet My Guest: Alexandr Speian
-
The Main Difference Between Selling on Amazon and Shopify
-
Sellerboard Dashboard Review
-
How to Switch Between Different Marketplaces On Sellerboard
-
Sellerboard Marketing Dashboard
-
Sellerboard Lifetime Value Dashboard
-
Sellerboard Products Page
-
Shipping Profile
-
Shipping Costs
-
Sellerboard Pick and Pack
-
Sellerboard Payment Fees
-
Sellerboard Indirect Expenses
-
Integrations
-
Settings
-
Users
-
Extended Sellerboard Free Trial (2 months)
-
Sellerboard Pricing
-
Conclusion
Disclosure: Hi! It's Vova :) Some of the links in this article may be affiliate links. I get a commission if you purchase after clicking on the link, this does not cost you more money, and many times I can even get a nice discount for you. This helps me keep the content free forever. For you. Thank you! :)
Learn How to Use Sellerboard for Shopify
Have you ever wondered how to get a clear, detailed look at your Shopify store's performance?
If so, you're in the right place!
In this article, we're diving into how to use Sellerboard for Shopify - a powerful analytics software designed to give you complete insights into your store's analytics and profits.
I'm Vova Even, and a few months ago, I had the pleasure of chatting with Alexandr Speian from Sellerboard on my YouTube channel.
During our chat, we explored how Sellerboard can be a game-changer for Shopify users.
Today's article provides a detailed and engaging recap of that conversation, tailored for those who prefer to delve into the discussion through reading rather than listening.
Expect a detailed walk through every feature of Sellerboard for Shopify, from start to finish.
We’ll also share tips and best practices to help you make the most of this software.
Plus, I’ve got an exclusive offer just for you — a two-month free trial with no credit card required, giving you full access to all Sellerboard features.
So, read on now to discover all the details and get started with your free trial today!
______________________
Introduction
Vova: Hey everyone! Today, we're diving into how to use Sellerboard with Shopify.
Sellerboard is a tool for analyzing Profits and has a lot of other useful features.
I personally use it for my Amazon business to manage inventory and track Profits, among other things.
But I’ve noticed that some Amazon sellers are also adding Shopify to their revenue streams.
So, why not use Sellerboard to manage your Shopify store's inventory and track its Profits, too?

Today, Alexandr (Alex) from Sellerboard is here to guide us through using Sellerboard with Shopify.
Alex, can you introduce yourself, and then we’ll dive into Sellerboard for Shopify?
Btw, we also have a tutorial that shows you how to use Sellerboard for Amazon.
Meet My Guest: Alexandr Speian
Alex: Sure, Vova. Thanks for having me.
I’m Alex from the marketing team at Sellerboard.
While Sellerboard is known for its Profit analytics software for Amazon sellers, we also have a solution for Shopify sellers.
Good news?
I’ll give you a brief demo, explain the features, and show how it can benefit you.
You might want to think about adding Shopify to your channels for selling products.
So, let me give you a quick overview of the software and the problems it can solve.
The Main Difference Between Selling on Amazon and Shopify
The main difference between selling on Amazon and Shopify is that on Amazon, people come to the marketplace already searching for specific products.
So, all you need to do is be there for them to find you.
On Amazon, traffic naturally finds its way to your listings if you have good SEO and run effective ads.
You probably know the strategies better than I do, but the customers are already there.
With Shopify, it’s a different situation.
You need to create campaigns to drive traffic to your site from around the internet.
But once you start spending on ads, a big question comes up: Are you using your advertising budget effectively? Are your campaigns profitable?
See, when it comes to advertising, you need to consider your number of conversions and return on investment (ROI).
Advertising on external channels to bring customers to your site has its challenges.
With the move toward a cookie-free environment and stricter regulations on third-party data, relying on that data is becoming more difficult.
That’s why having first-party data — information you collect directly from your own website — is much more valuable and accurate.
Sellerboard for Shopify lets you use your first-party data to analyze your campaigns.
You can see where your customers are coming from, when they visit, what their landing page was, and other UTM parameters.
These details help you understand the source of your traffic and ultimately, your sales.
So, if you’re ready, I’m ready to start the demo.
Sellerboard Dashboard Review
Vova: Let’s go!
It’s true, tracking where your customers come from can be tricky with an eCommerce website.
Sellerboard seems to have a solution for that.
I’ve found it really useful for our Amazon business, so I’m excited to see how it works for Shopify.
I’m not a Shopify seller myself, but we have viewers who are.
Let’s see if we can help them.
Alex: Alright, let’s do it!
I’m going to share my screen now.

For those familiar with Sellerboard for Amazon, this dashboard will look similar because the Profit dashboard layout is the same.
If you’re new to Sellerboard, this is the Profit dashboard.
It provides the tools you need to analyze your profitability at different levels, including account level, product level, and more.
You can use several types of views to do this.
Up here, you have the Tiles view, which is what we’re looking at now.
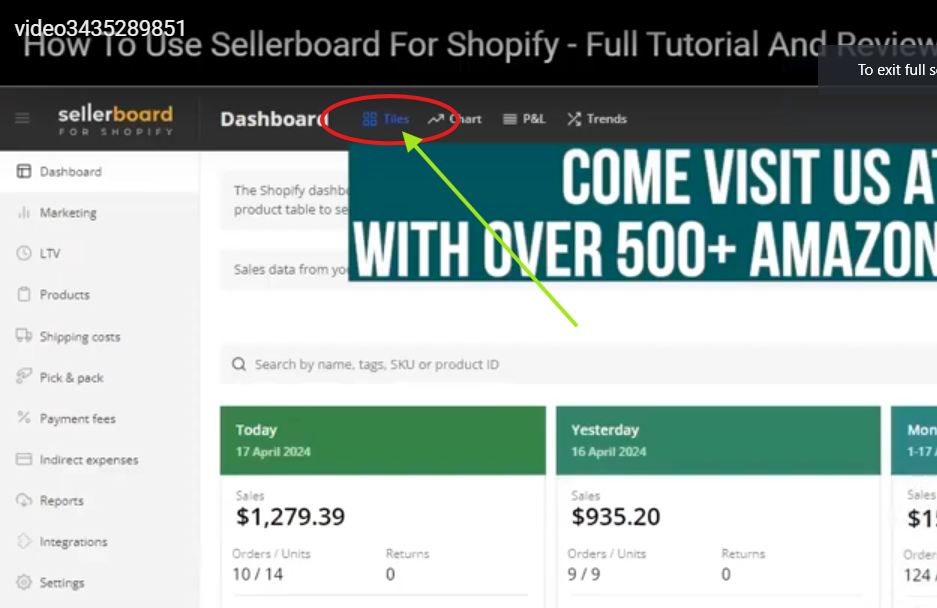
You also have options for Chart view, P&L view, and Trends view.
I’ll show you those in a moment.
For now, let’s focus on the Tiles view.
Each tile represents a specific time frame and is customizable.
You can choose which time frame to display in each tile.
For example, this tile is set to show data for today.
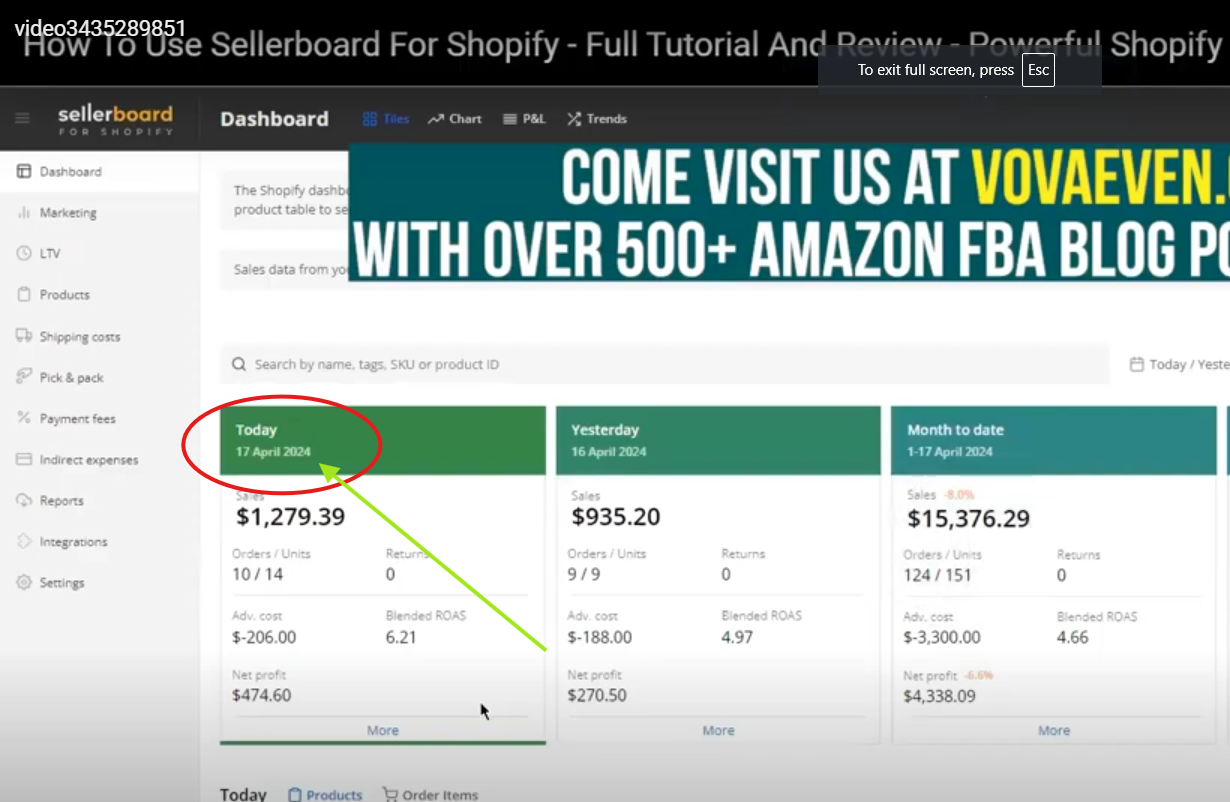
Right now, you see sales, number of orders, returns, advertising costs, and net profit for this day.
You can compare it to another date, like yesterday, to track your progress and see how things are changing.
It’s a quick way to get an overview of your performance.
If you want more details, you can click on "More" down here.
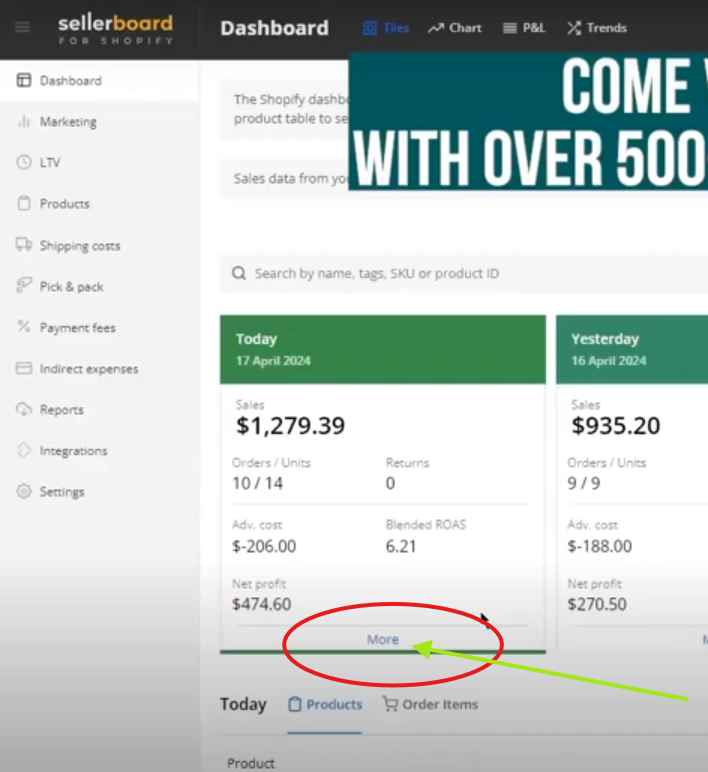
This will show you how your profit calculation was done, including the factors considered and how each cost affected your initial sales to determine your net profit.
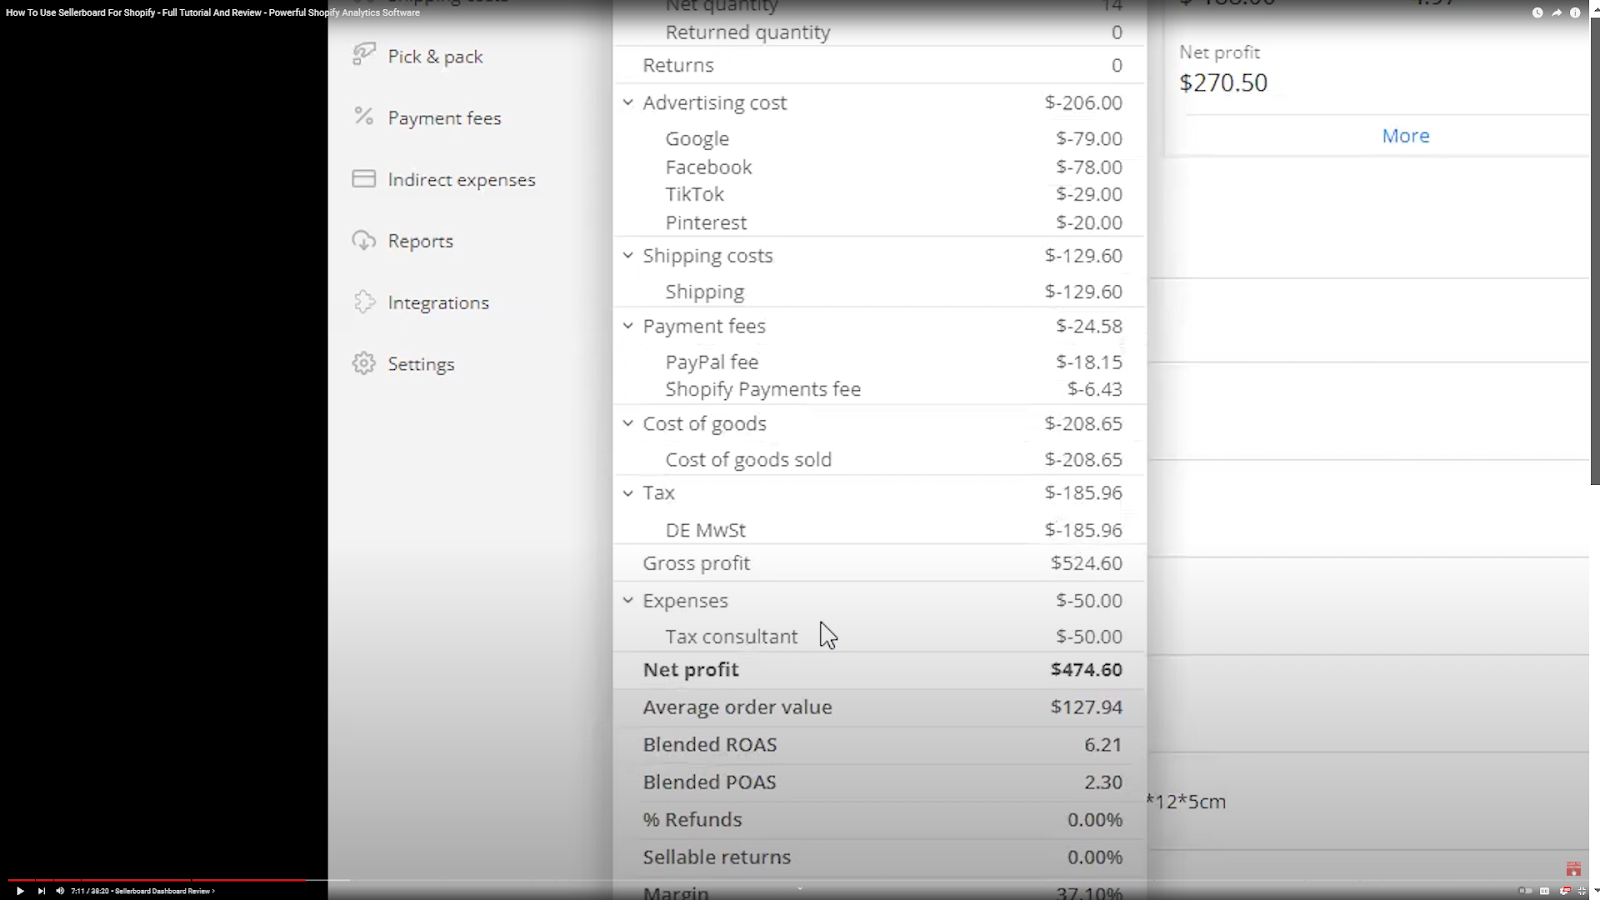
As shown in the screenshot above, you’ll be able to see your sales divided into gross sales, promotions, and shipping charges.
You’ll also see the number of orders, units sold, and advertising costs for any external marketing channels linked to your Shopify account.
We pull this data directly from your advertising accounts, but I’ll explain more about that later.
Besides this, you’ll see your shipping costs and payment fees, or gateway fees.
When a customer pays for your product on Shopify, you connect different payment systems to your Shopify account.
Each payment method has its own fee or gateway fee, and these will be shown here.
These fees are customizable.
Next, you’ll see your cost of goods and any taxes that apply in your home country.
This leads to your gross profit.
Finally, you can also include any overhead expenses for your business that aren’t directly related to costs on Shopify.
This might include costs like accounting services, product photography, virtual assistance, or other expenses.
We have a separate dashboard for these, and I’ll show it to you soon.
After accounting for these, you’ll see your net profit and other metrics that give you insight into your performance, like your return on advertising spend (ROAS).
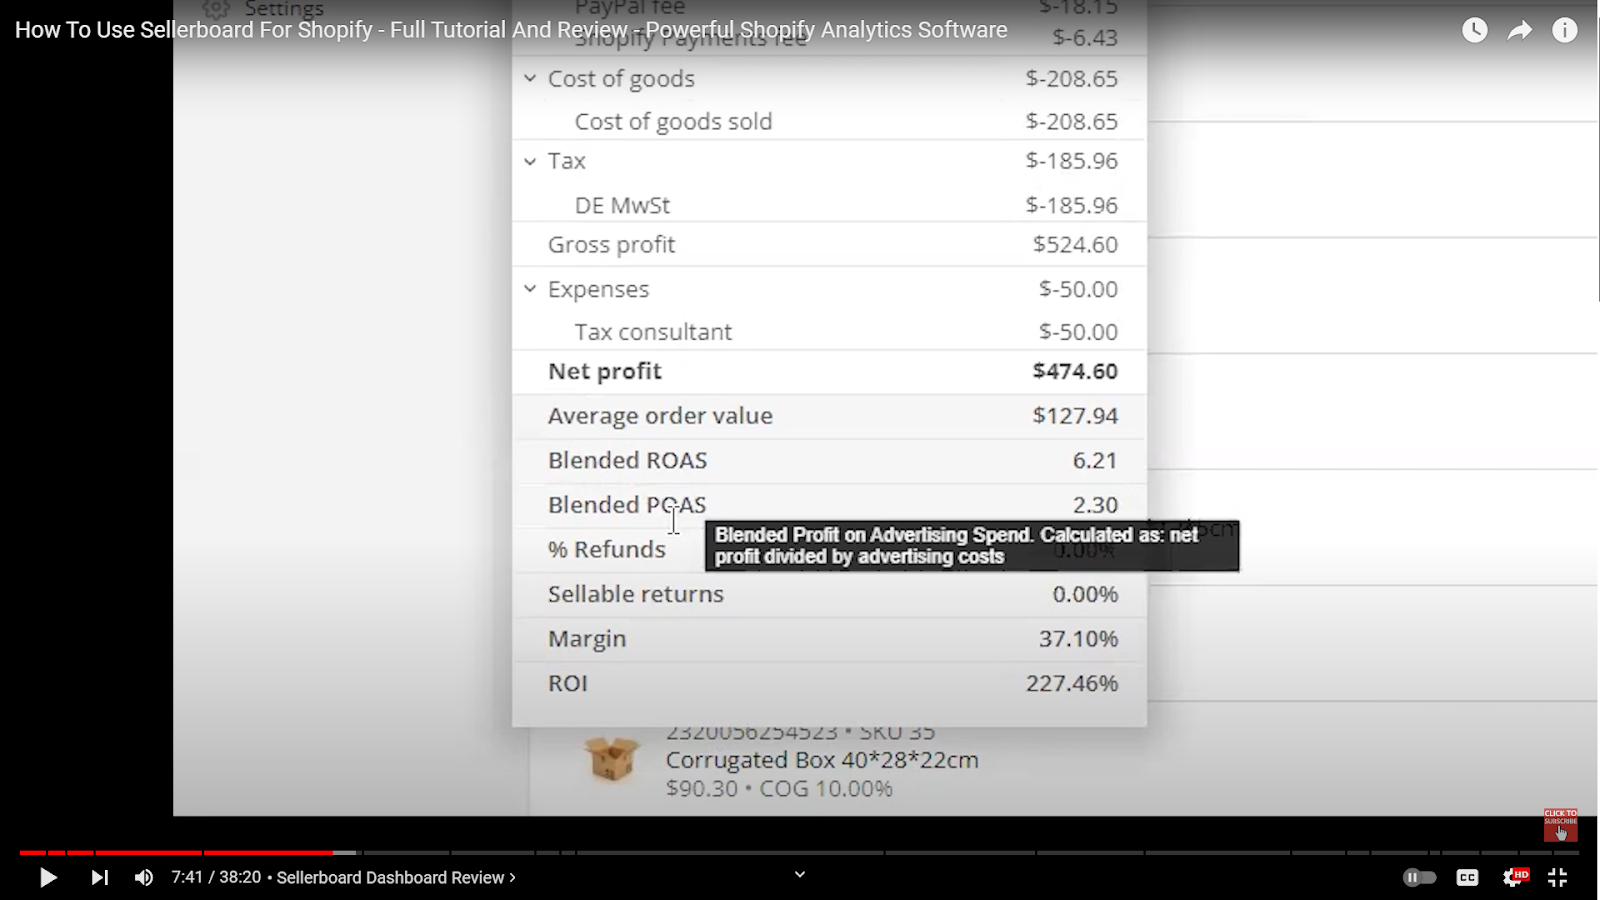
As you can see in the screenshot above, we’ve also added a new metric: Profit on Advertising Spend (POAS).
While ROAS is commonly used, sometimes it doesn’t fully reflect the effectiveness of your ads.
If you have a low margin, it’s better to look at the relationship between your profit and advertising spend.
This is crucial when your additional costs are high.
We added this metric because many users requested it.
So, that’s a breakdown of what you can see at the account level.
You can compare these periods at the account level.
Next, we have the Products view.

In this view, you can see which products were sold during a specific period and you can see different metrics for each specific product.
For example, if I look at this jewelry red box, I see that I sold three units today, totaling $291.72.
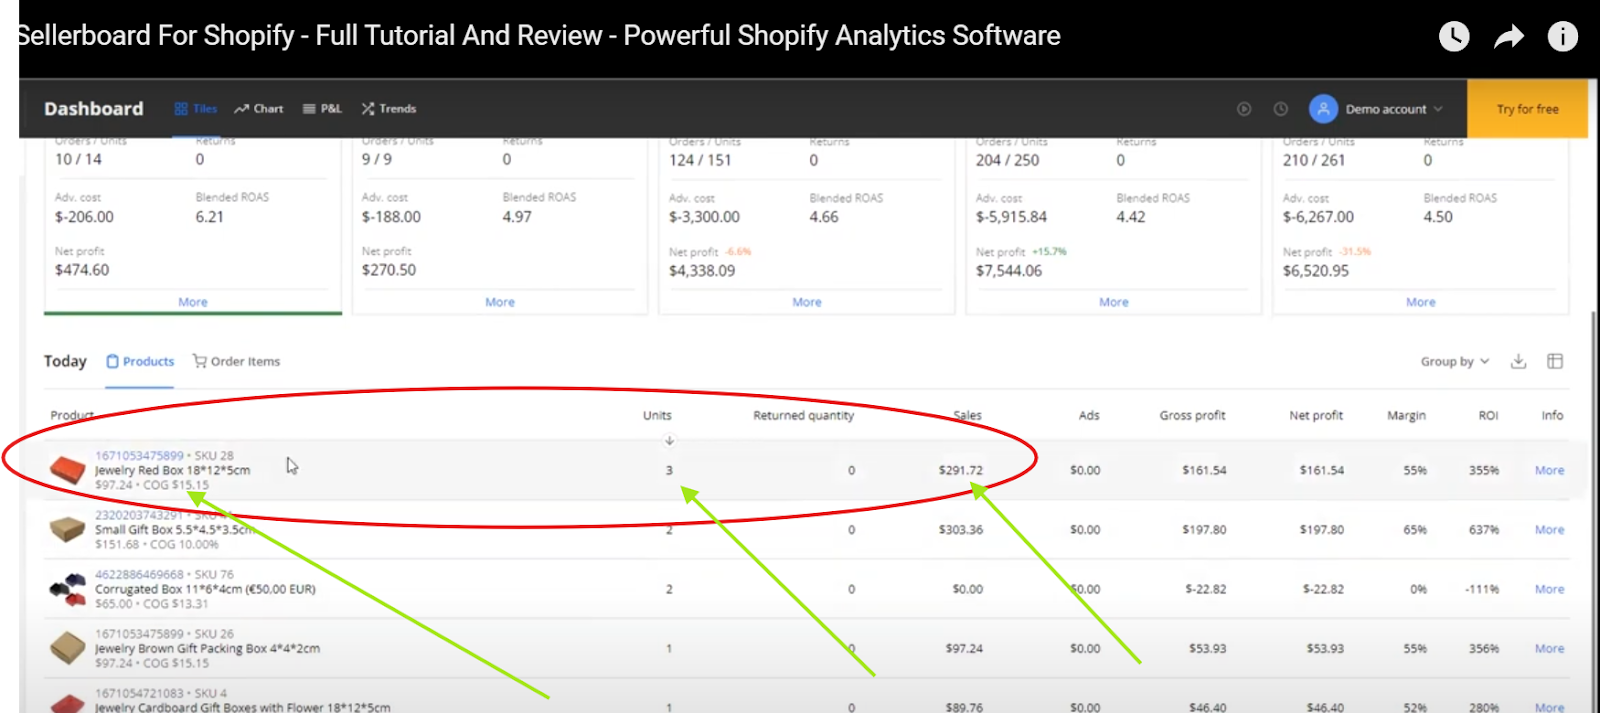
I spent nothing on advertising, so my gross profit and net profit are the same, as there were no additional expenses.
You can click "More" to expand the metrics and see a detailed breakdown of how the profitability was calculated for this product.
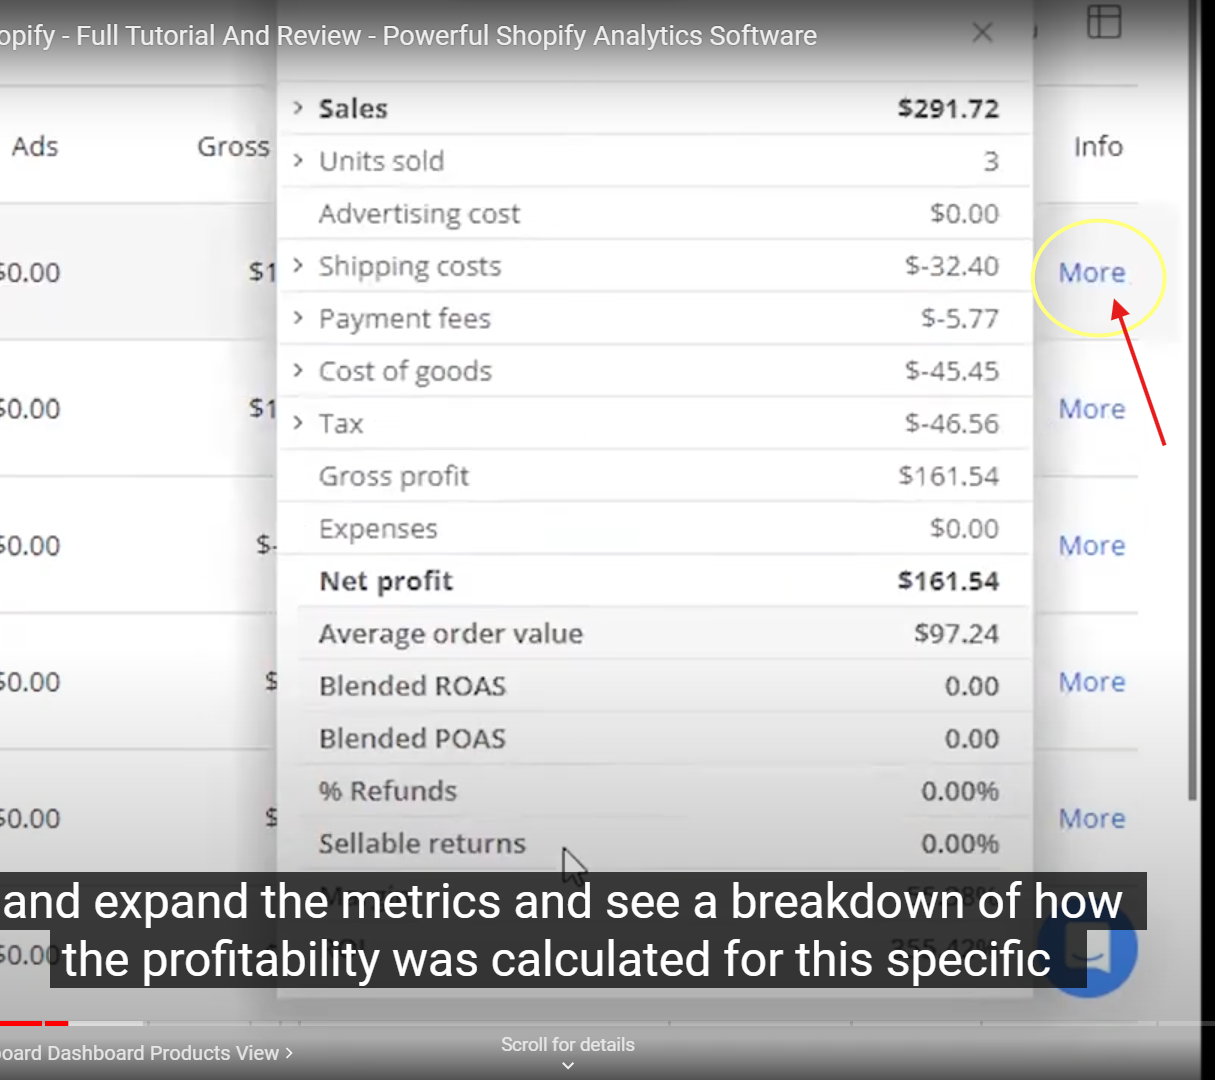
And if you want to add more metrics to the spreadsheet, you can press this button to choose additional details for the Products view.

For example, if you want to include shipping costs, just check the box, and they will appear so you can see how much you spent on shipping for each product.

The same goes for your orders.
You can select a period and view the orders from that specific time.
You also have tools to filter your results and select specific products.
For Shopify, it's important to analyze different channels.
How to Switch Between Different Marketplaces On Sellerboard
While Amazon users can switch between different marketplaces like the US or the UK, Shopify sellers might have various sales channels.
These could include your main website, TikTok store, Flip.shop, Snappy, or other third-party services that send customers to your Shopify store.
You’ll want to analyze those channels separately because each one has its own advertising costs, and you need to see how well you're performing.
This is where you select the channels you want to analyze.
That covers the Product view and Tile view.
Next is the Chart view.

For those familiar with Sellerboard for Amazon, it’s quite similar.
The Chart view shows the changes in specific metrics over time at the account level.
Right now, it's displaying units sold, advertising costs, returns, net profit, and how these metrics have changed over time.
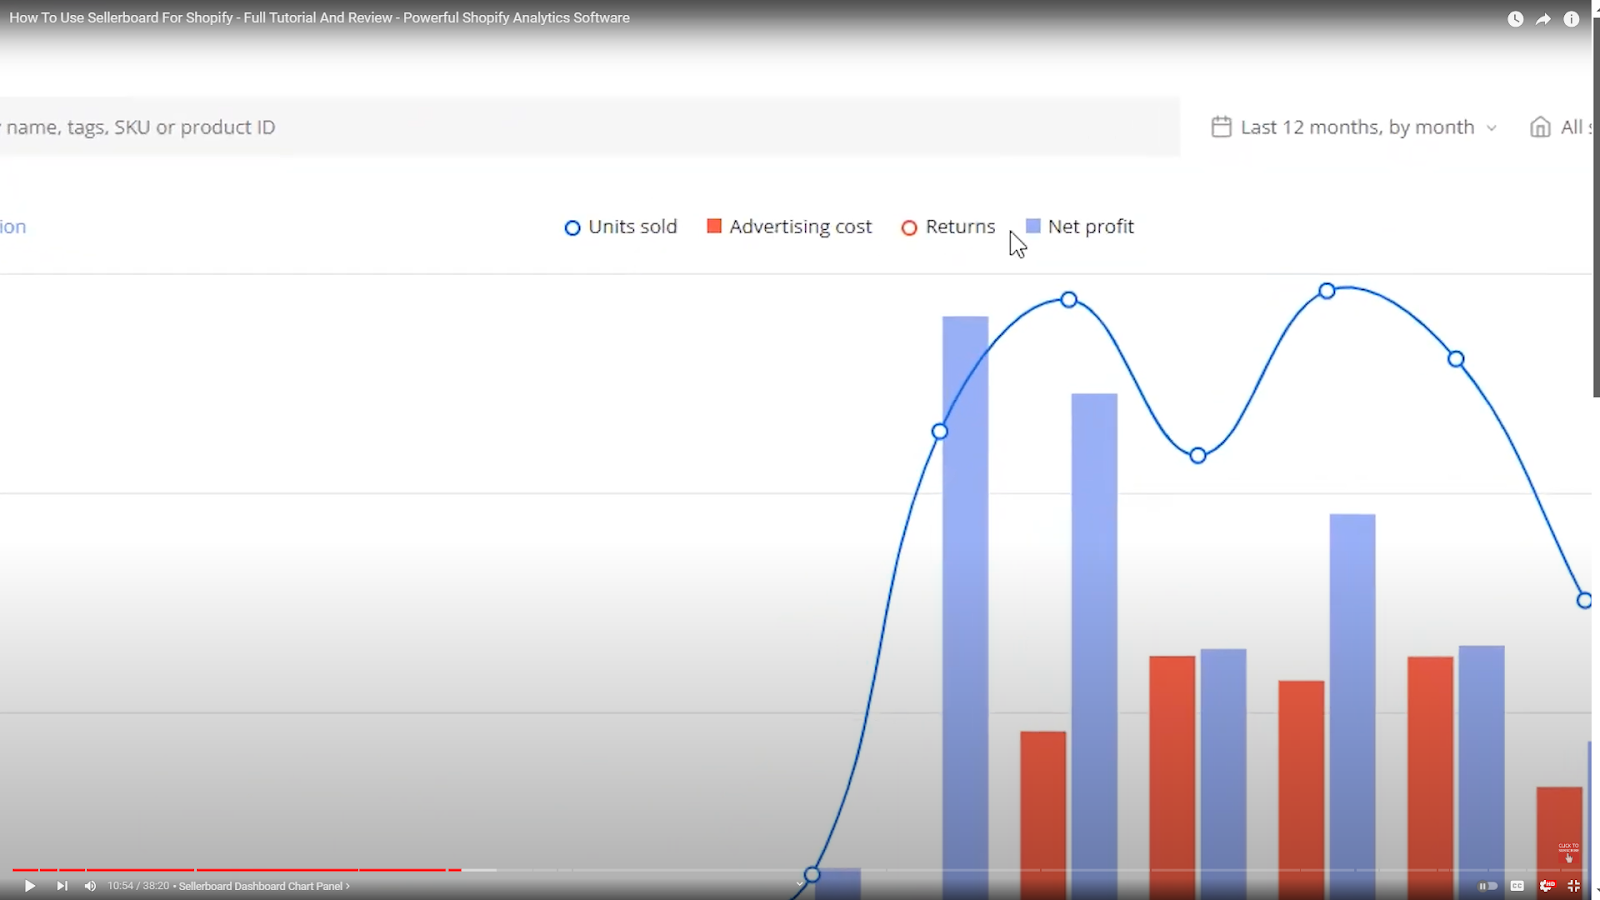
You can see this month by month.
If you click on the configuration button on the left, you can choose other metrics you’re interested in.
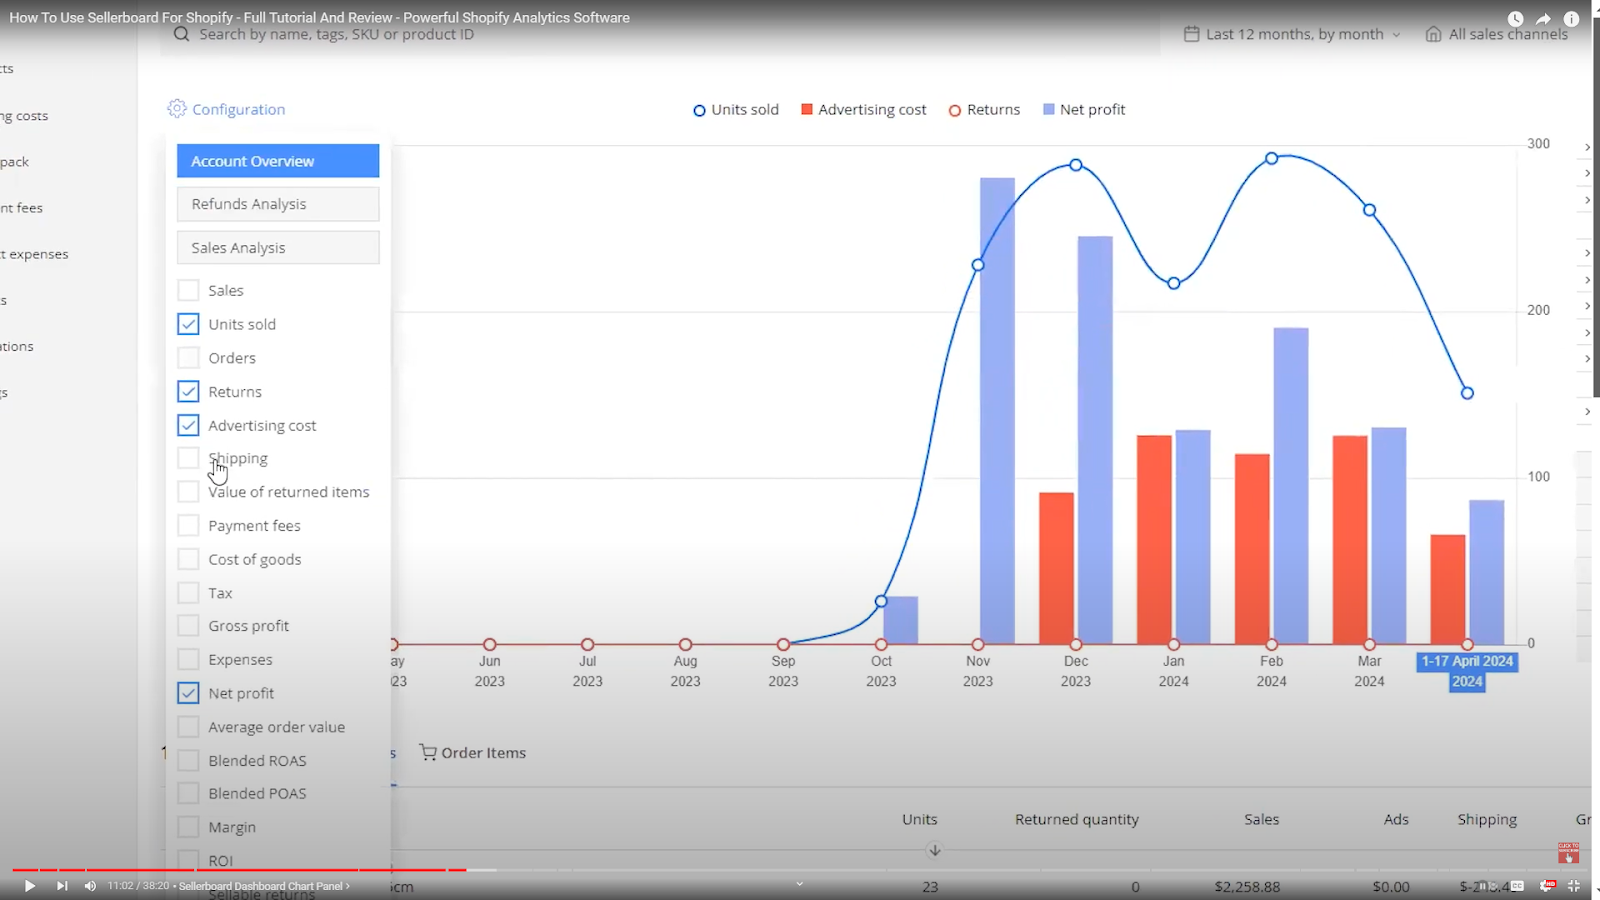
For example, if you want to track how your profit margin has changed, you can select that option and it will appear on the chart.
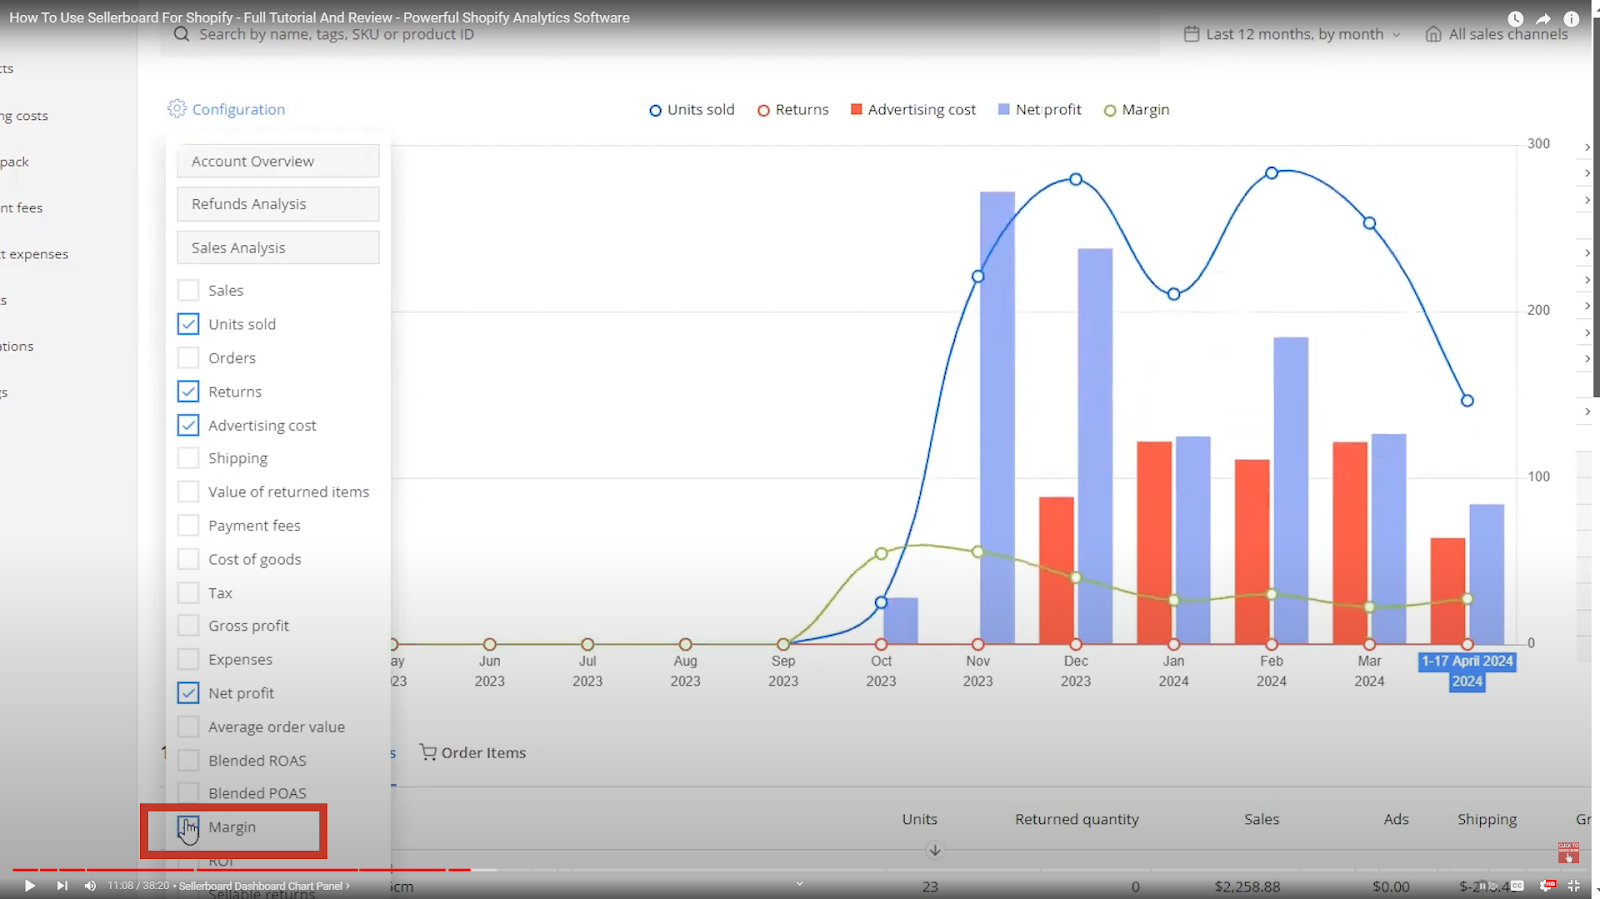
This is the main function of the Chart view.
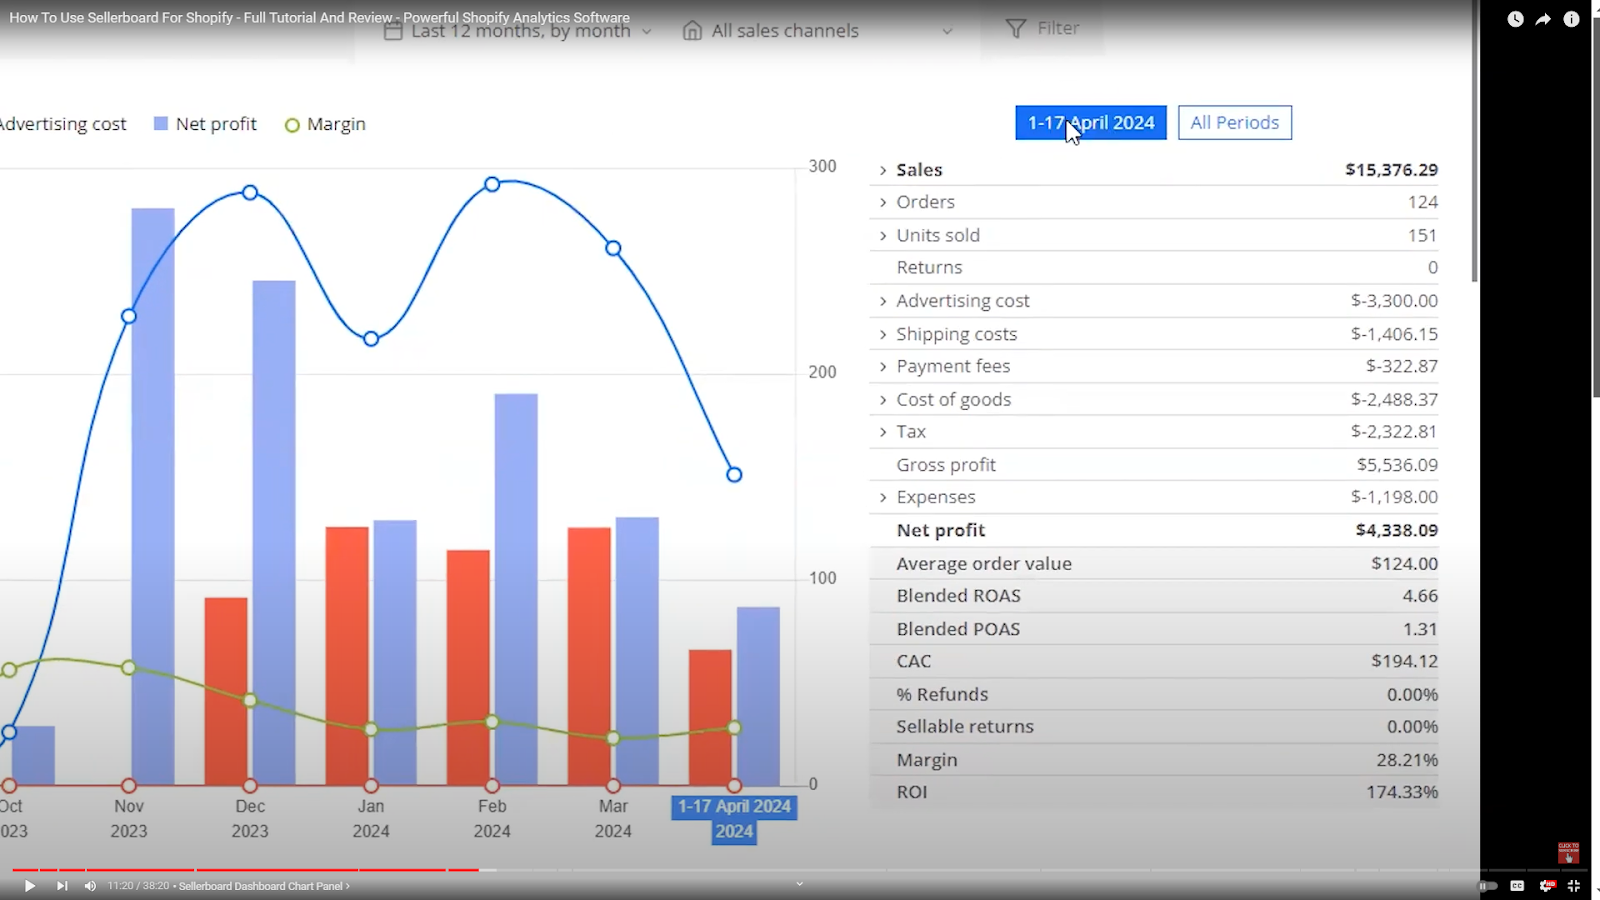
For the selected period, which you can adjust, you’ll see the key metrics for profit calculation and the products sold during that time at the bottom of the screen.
Then, we have the P&L view, which is like a giant spreadsheet showing all the key metrics for your Shopify business month by month.

You can also set it up to display day by day if you’re looking at a 30-day period.
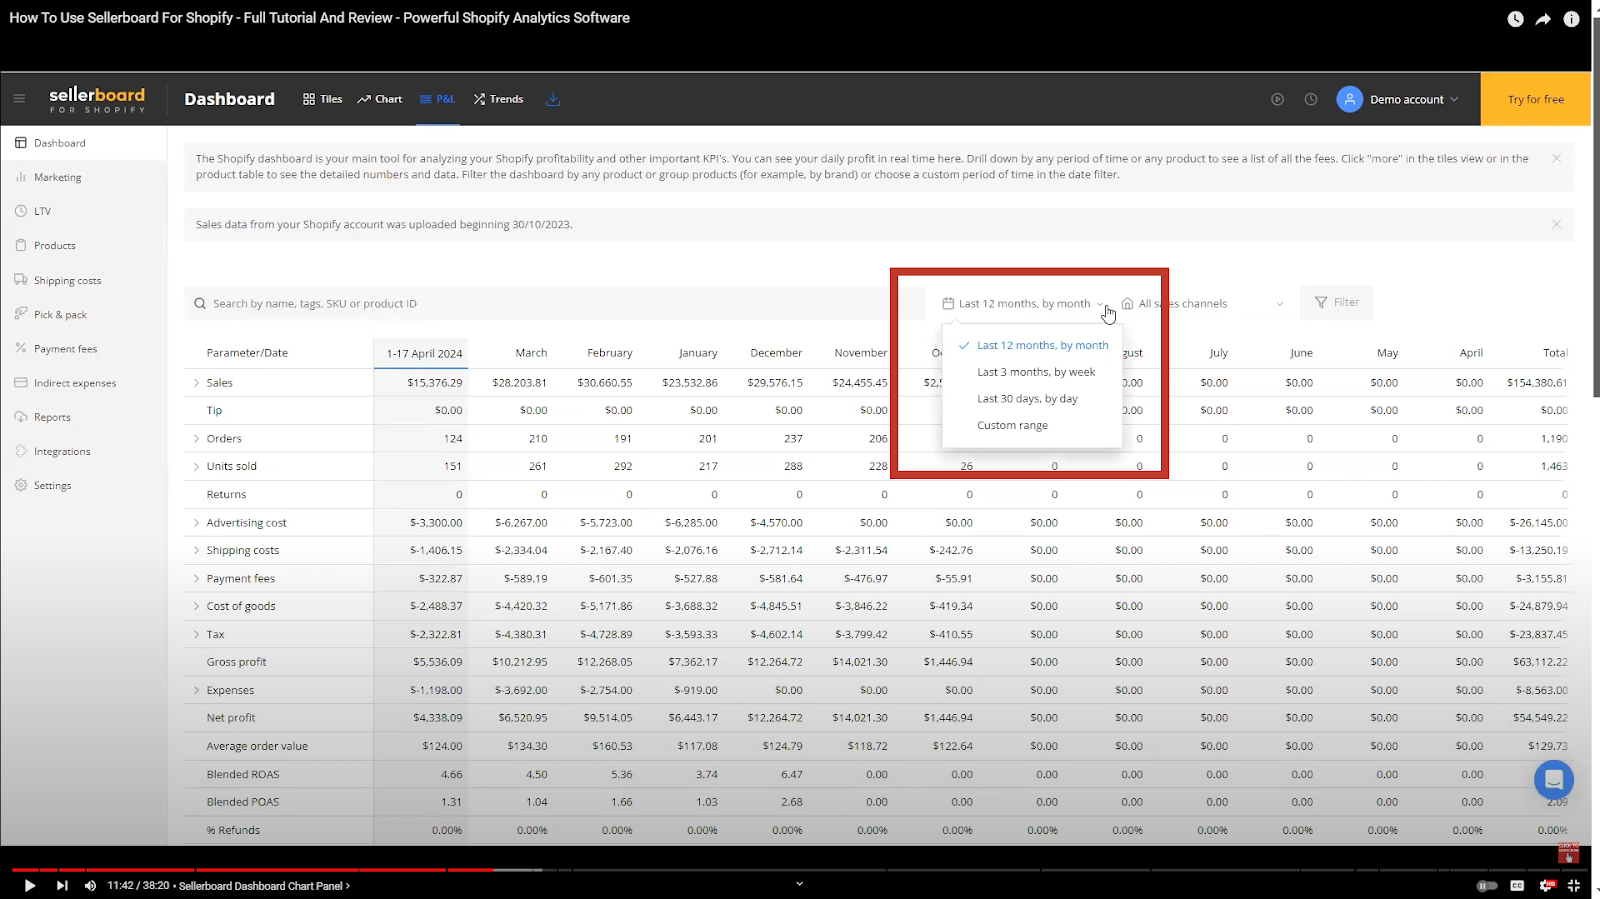
This allows you to analyze how different metrics change over time.
For example, if you want to review how your advertising costs have evolved, you can click on it and expand it to view different channels.
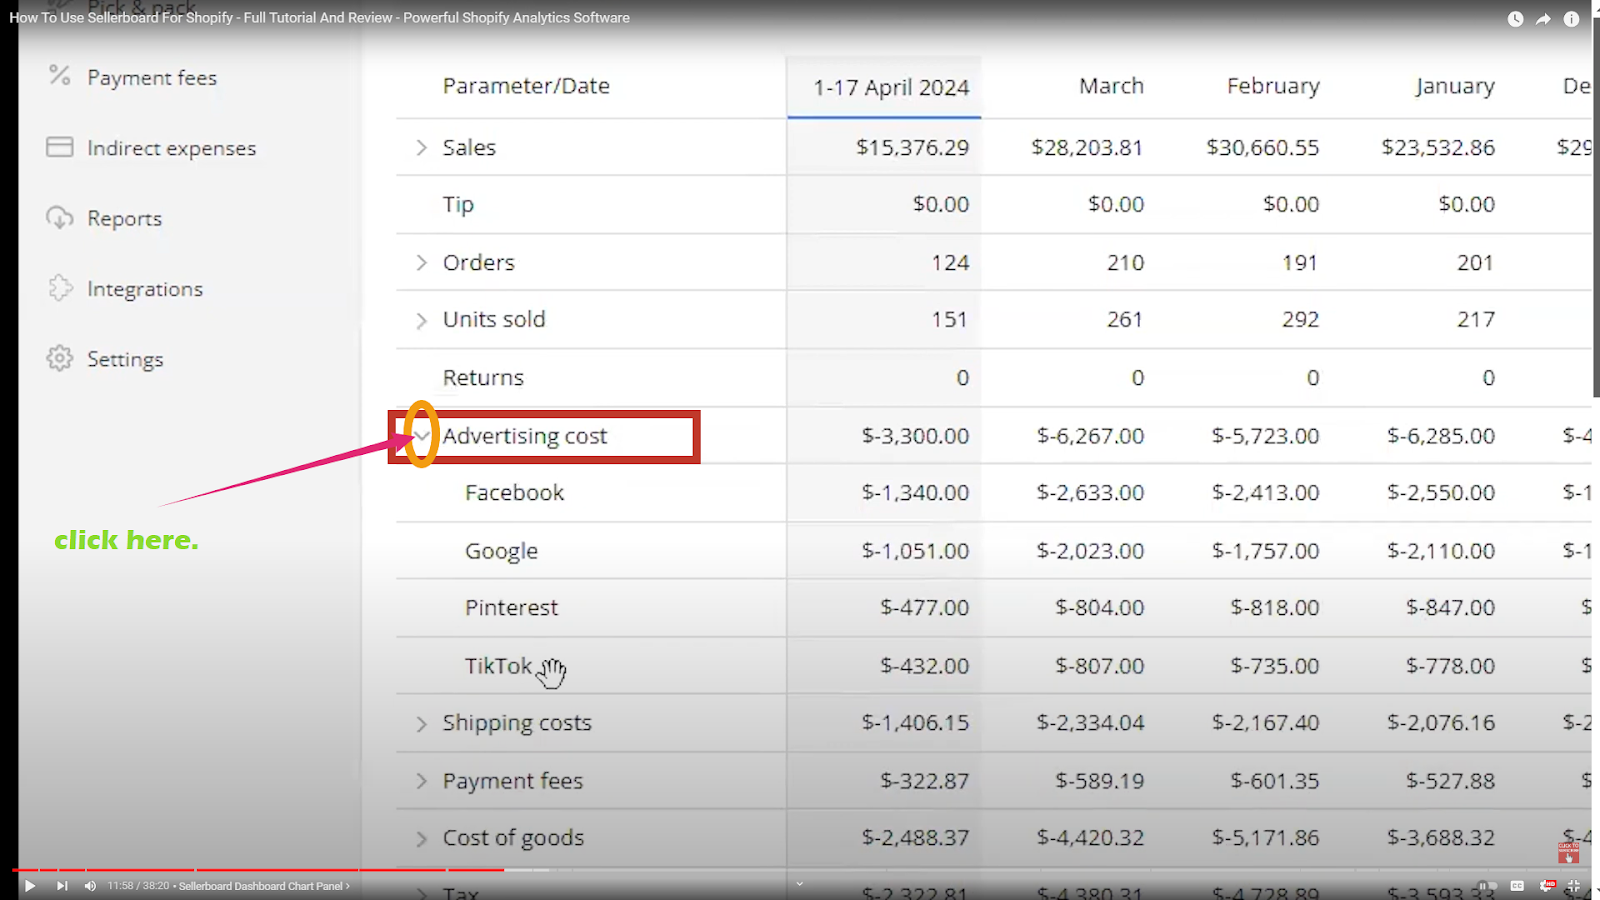
I've got a demo account by the way.
So, as per this, in January, my advertising costs for Facebook increased, then decreased in February, and went up again.
As of mid-April, I can project that my advertising costs will likely follow a similar pattern to March’s.
To dig deeper into product-level trends and see how metrics evolve for specific products, you’ll use the Trends view, which is located up here.
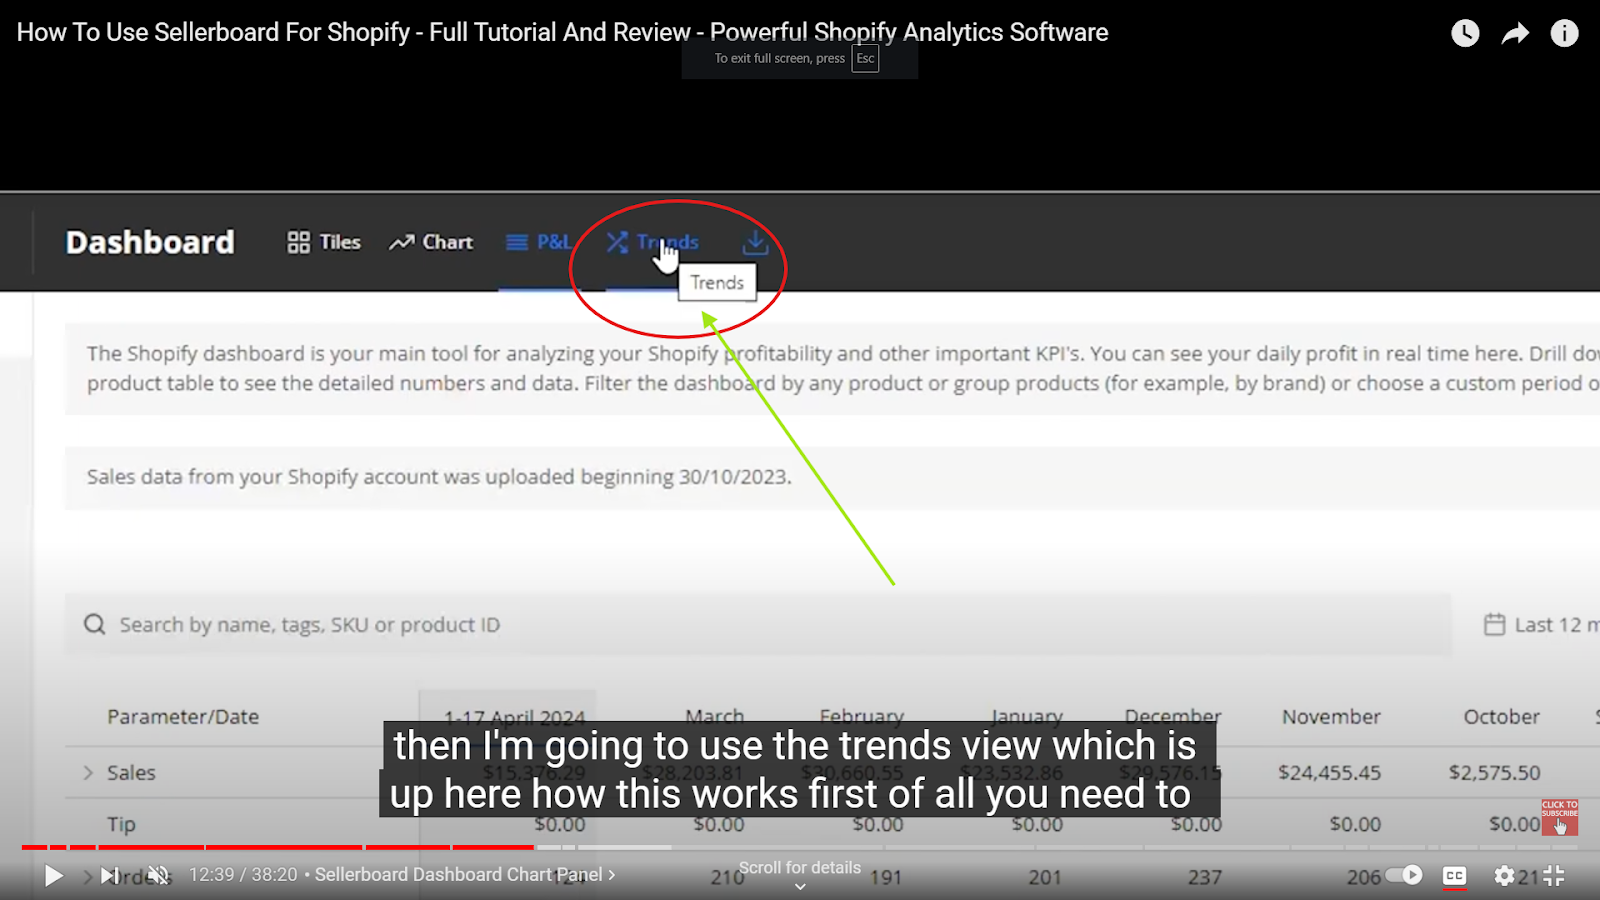
To start, you need to select the metric you’re interested in.
For example, if I'm focusing on sales, I'll keep it set to sales, and then I’ll see the metric displayed month by month.

Alternatively, you can choose to view it day by day on the product level.
That small chart in front of every product will help you quickly identify any emerging trends, allowing you to act on them.
This is a useful way to analyze trends on a product level.
The last thing to mention is that you can always export this data.
You have a button right here at the top of the screen because sometimes it's important to share this data or maybe do your own analysis.

So, you can always do that.
Now, let’s dive deeper into the Sellerboard Marketing dashboard.
Sellerboard Marketing Dashboard
I want to talk about the Marketing dashboard, which, in my opinion, is one of the most interesting features in Sellerboard for Shopify.
As I mentioned earlier, managing advertising across different social media platforms and Google can be challenging.
You end up spending a lot of money on various campaigns.
And then there’s the issue of not being sure how your sales are attributed to your advertising campaigns.
This challenge has become more pronounced with the introduction of iOS 14.5 and the evolution of new browsers.
Personal data is increasingly important, and people are more conscious about protecting their personal information and minimizing their digital footprint.
As a result, advertising platforms find it more challenging to provide accurate results on where your advertising budgets are yielding the most conversions and performance.
That’s why, even if you’ve done advertising on platforms like Facebook, you might have noticed that they often include a disclaimer.
Due to the changes brought about by iOS 14.5 and recent updates in popular web browsers, they’re now using AI models to project final results.
They’re not always certain about the exact outcomes of the conversions they report.
The issue is that they rely on third-party data.
With Shopify, however, the advantage is that it provides first-party data directly from your website.
This means you get data straight from the source — your customers who visit your site — rather than relying on information from platforms like Facebook or TikTok.
Those platforms only have access to the data gathered through their pixels, which is quite limited.
I’m mentioning all this to explain how we address the problem and provide a solution.
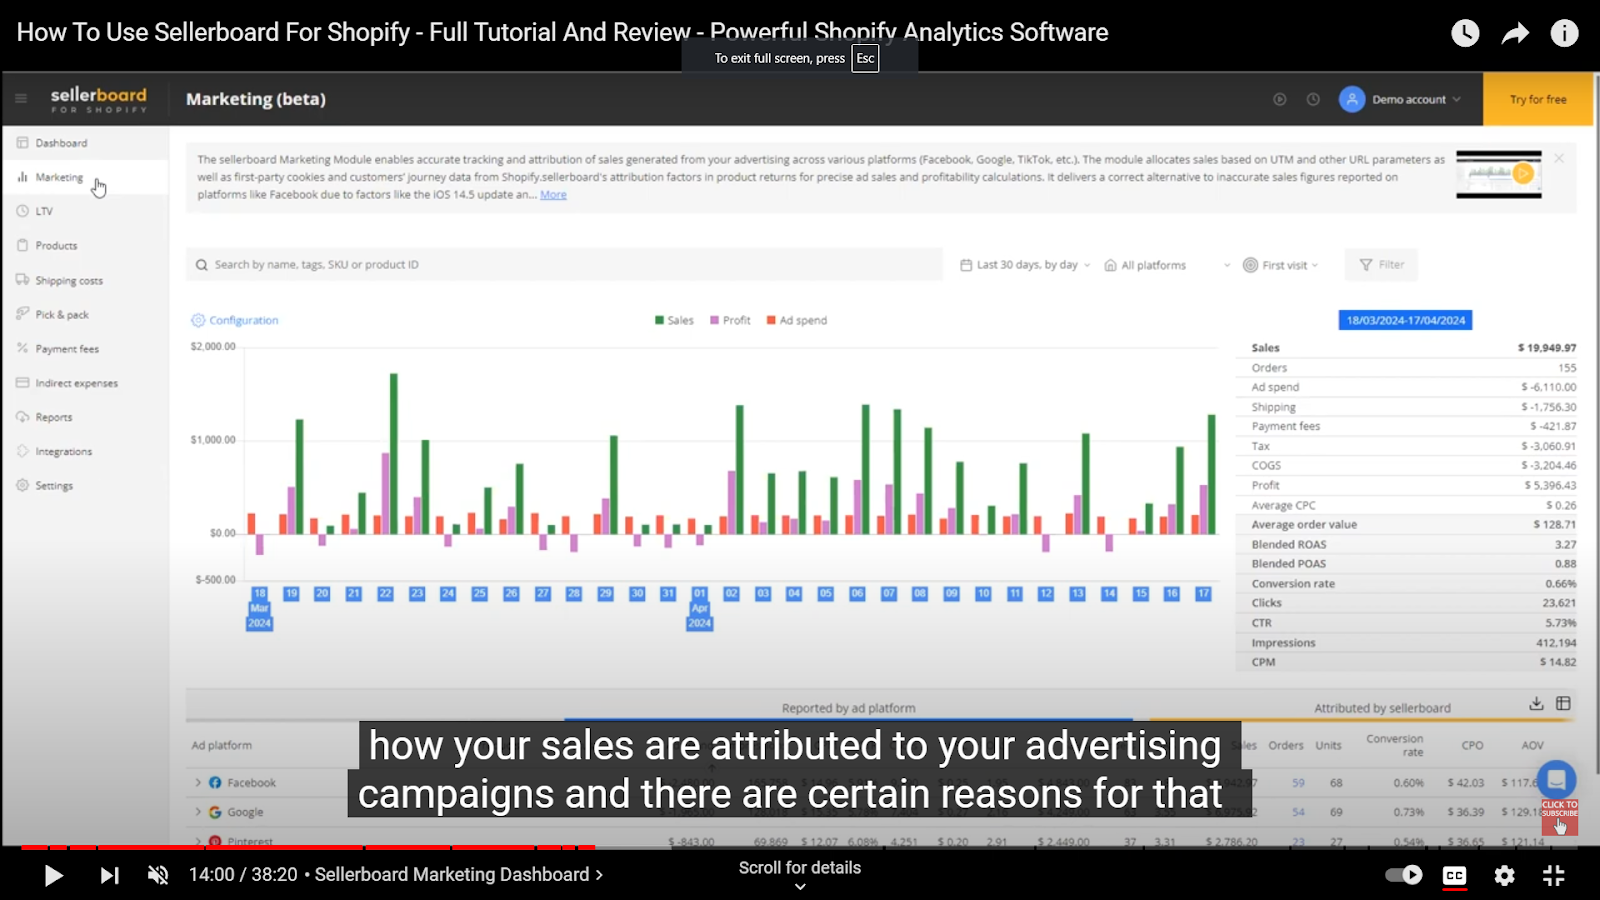
Now, getting back to the topic, here is the Marketing dashboard.
You can use it to analyze your campaign performance, budgets, and profit.
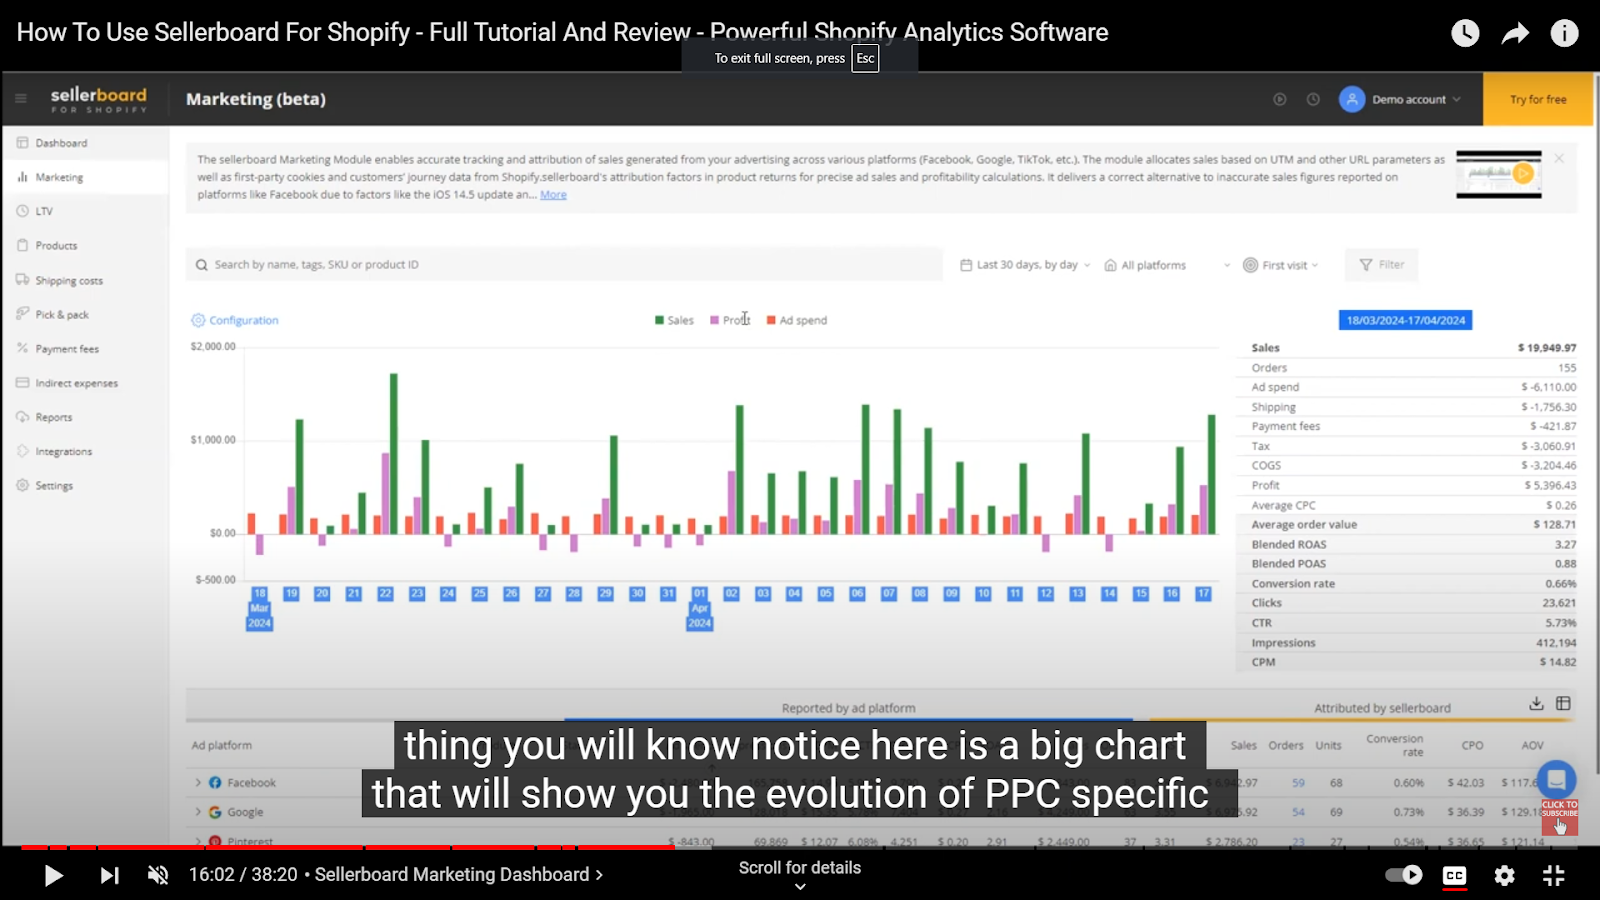
The first thing you’ll notice is a large chart that displays the evolution of PPC-specific metrics for the time frame you’ve selected.
You can click on the configuration button to select the metrics you're interested in, such as the evolution of your CTR or the number of impressions over time.
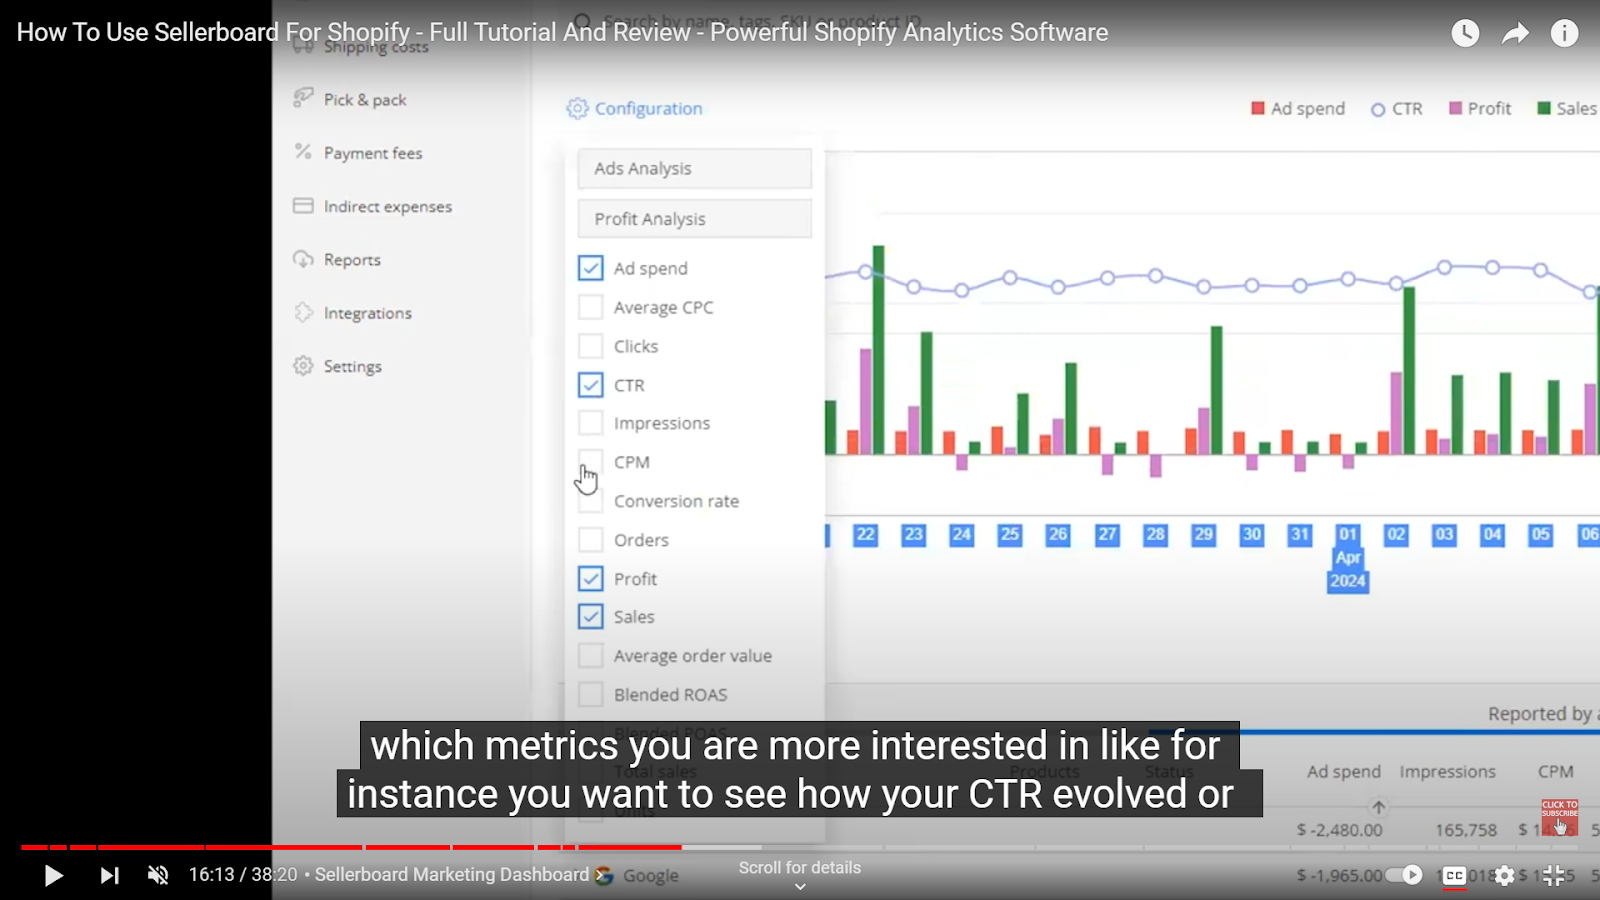
This data will focus only on your PPC sales, not all sales during the selected period.
Now, coming to the best part: down here, you’ll see all the platforms currently connected to your Sellerboard for Shopify account.
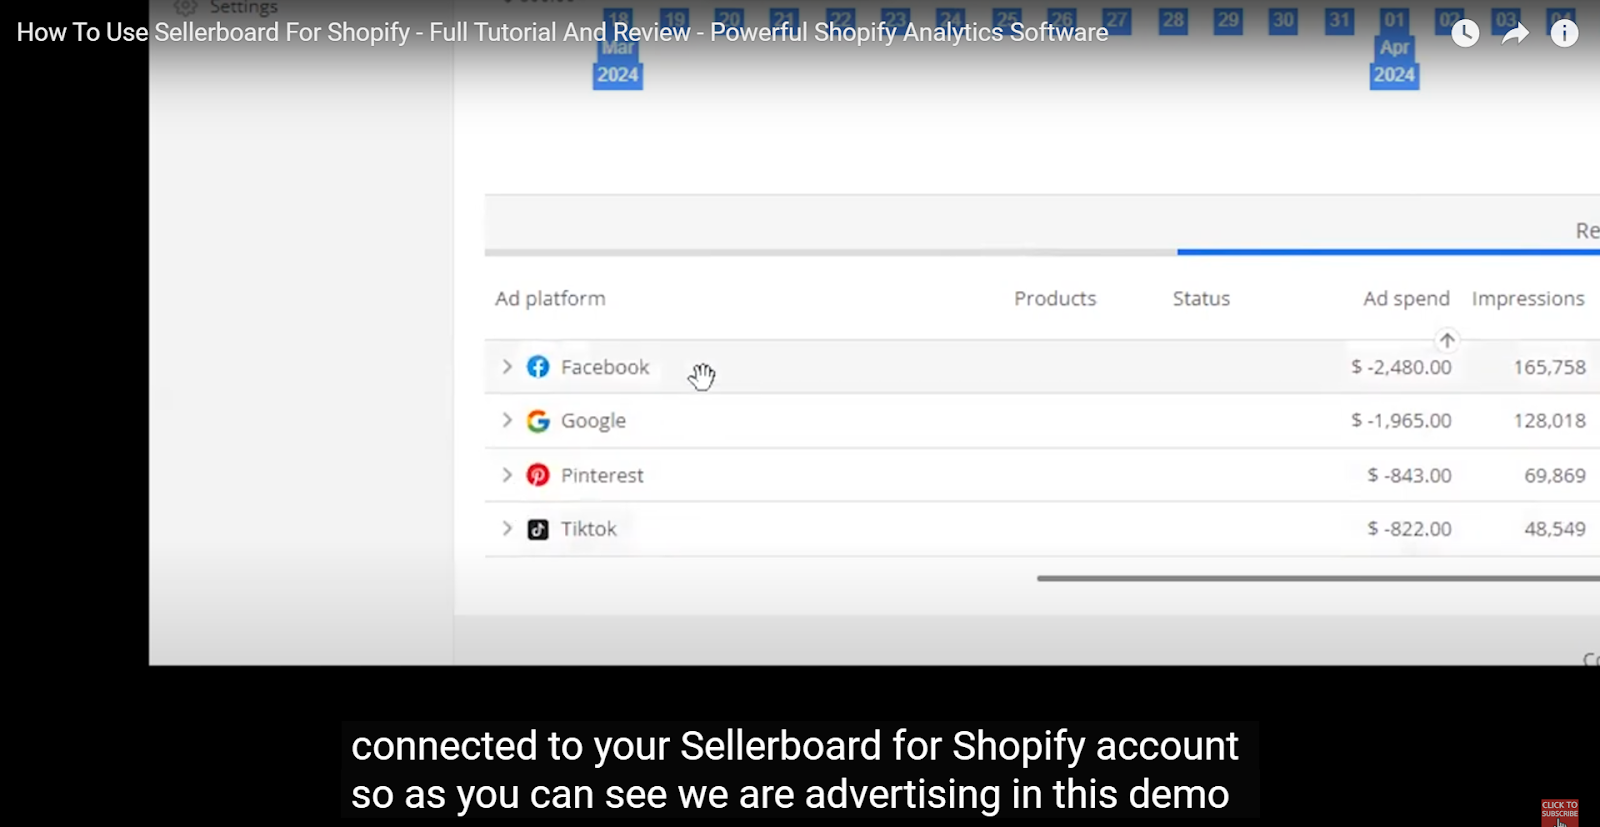
As you can see, in this demo account, we’re advertising on Facebook, Google, Pinterest, and TikTok.
There are two main areas here: the first area shows the data reported by the advertising platforms.
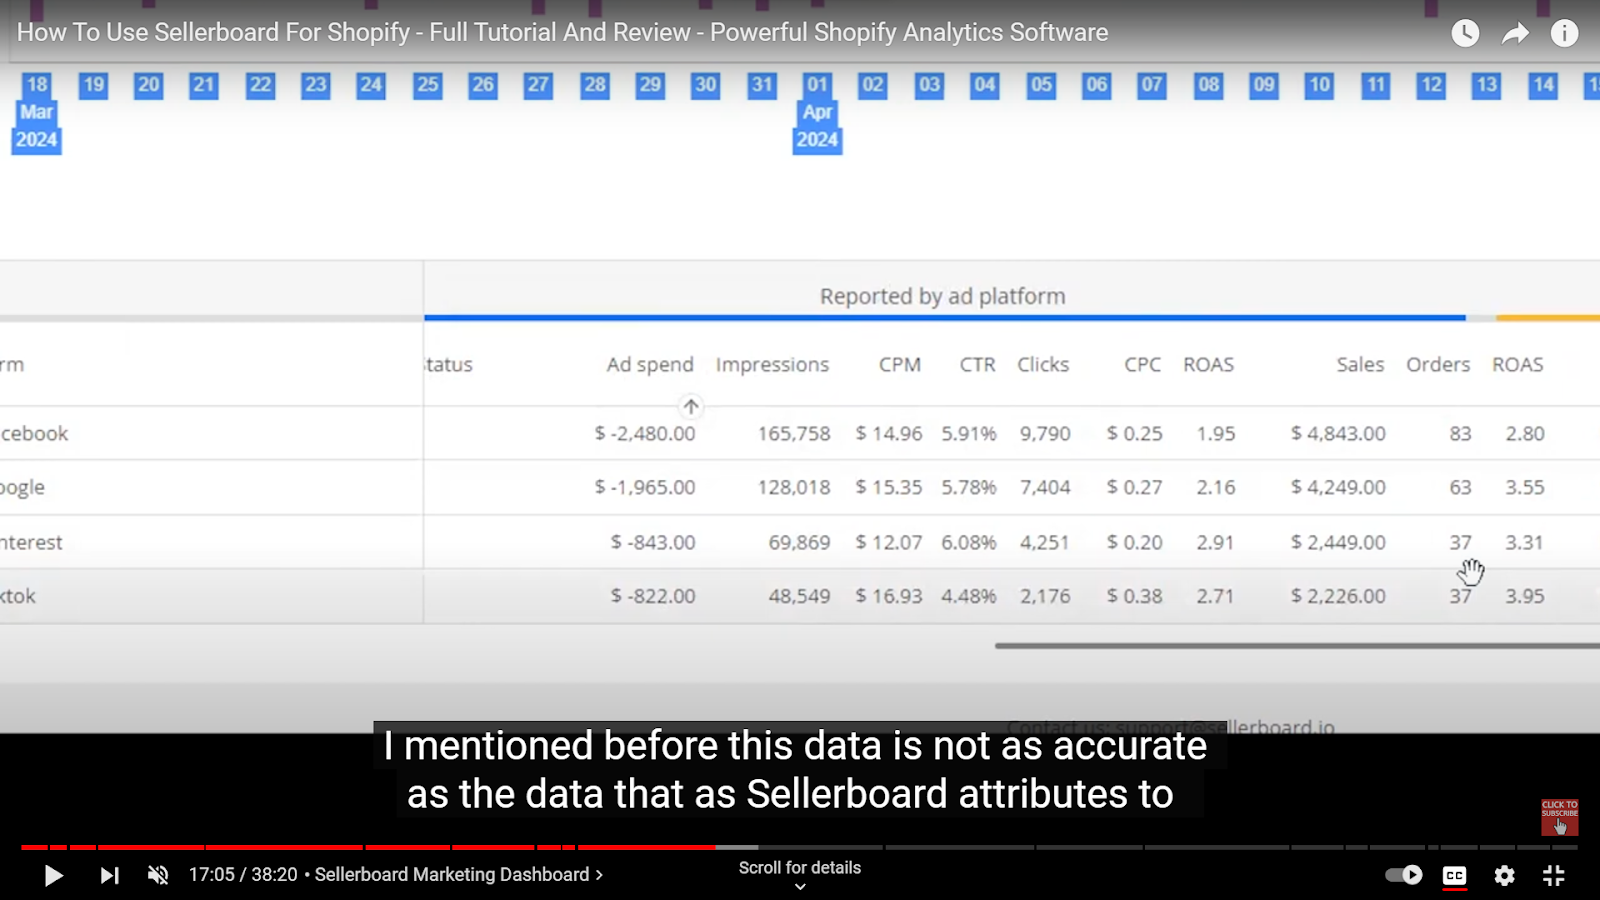
You’ll see the key metrics from these platforms, but keep in mind that this data isn’t as accurate as what Sellerboard provides.
We attribute the final sales using data directly from Shopify, which gives us a more precise picture.
Let me break it down a little bit.
First, as shown in the screenshot above, you’ll see the main PPC metrics: impressions, CPM, CTR, clicks, CPC, and others.
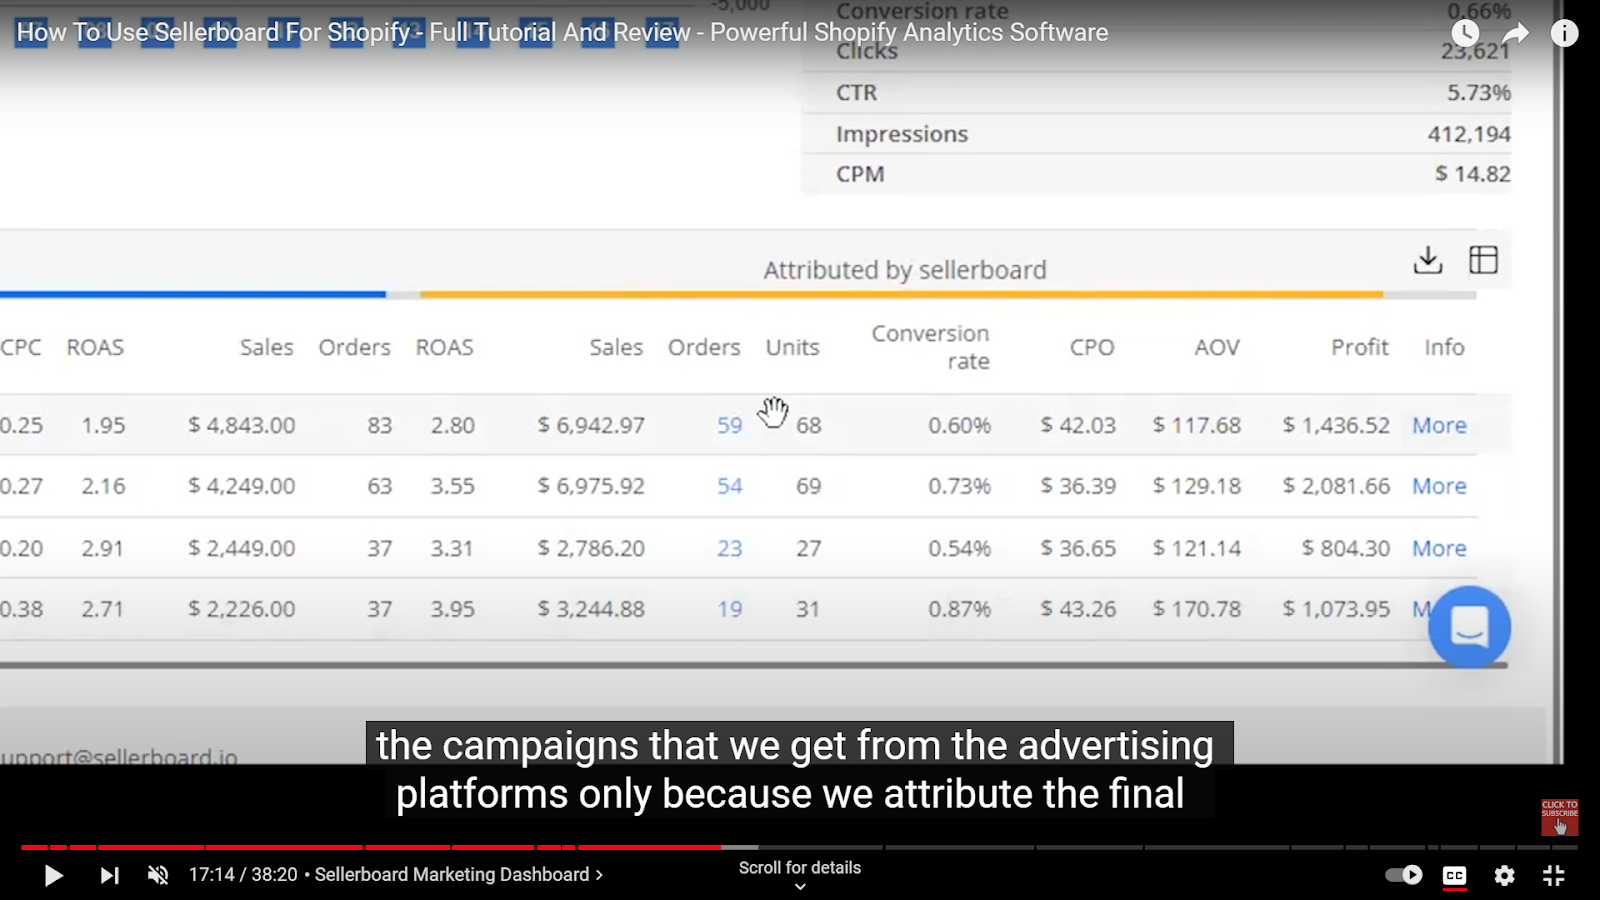
Second, Sellerboard provides sales attributed by platform.
For instance, we found nearly $7,000 in sales from Facebook advertising, whereas the ad platform itself only attributed $4,843.
So, if you judge solely by the numbers from Facebook, your campaigns and advertising might appear unprofitable due to lost attributions.
That means, if a customer visits your website from a Facebook ad but doesn’t purchase immediately, and then returns a few days later to make a purchase, Facebook won’t attribute that sale to the original campaign.
But Shopify will attribute that sale, as it recognizes it as the same customer making another visit.
You can actually configure which visit triggers the attribution.
Let me show you the customer journey map from Shopify that we use for attributing sales.
I want to provide this example to highlight that metrics can differ.
Higher sales attributed to campaigns will affect your overall conversion rates and, consequently, the profit attributed to those campaigns.
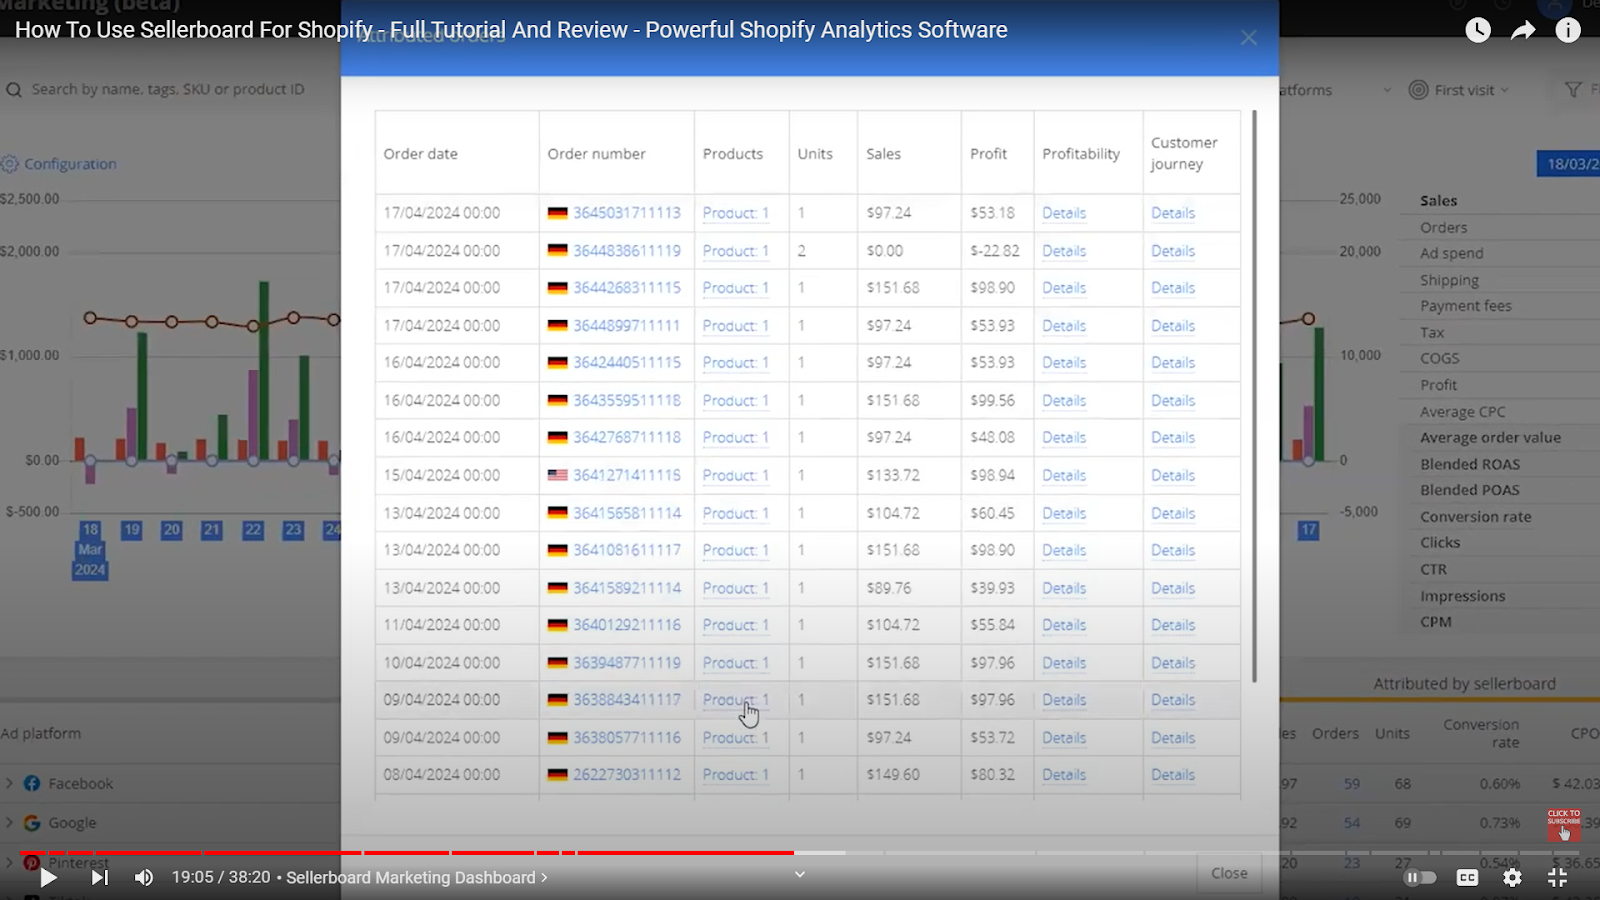
If you want to see how these attributions were made, you can always click on the number of orders attributed by Sellerboard.
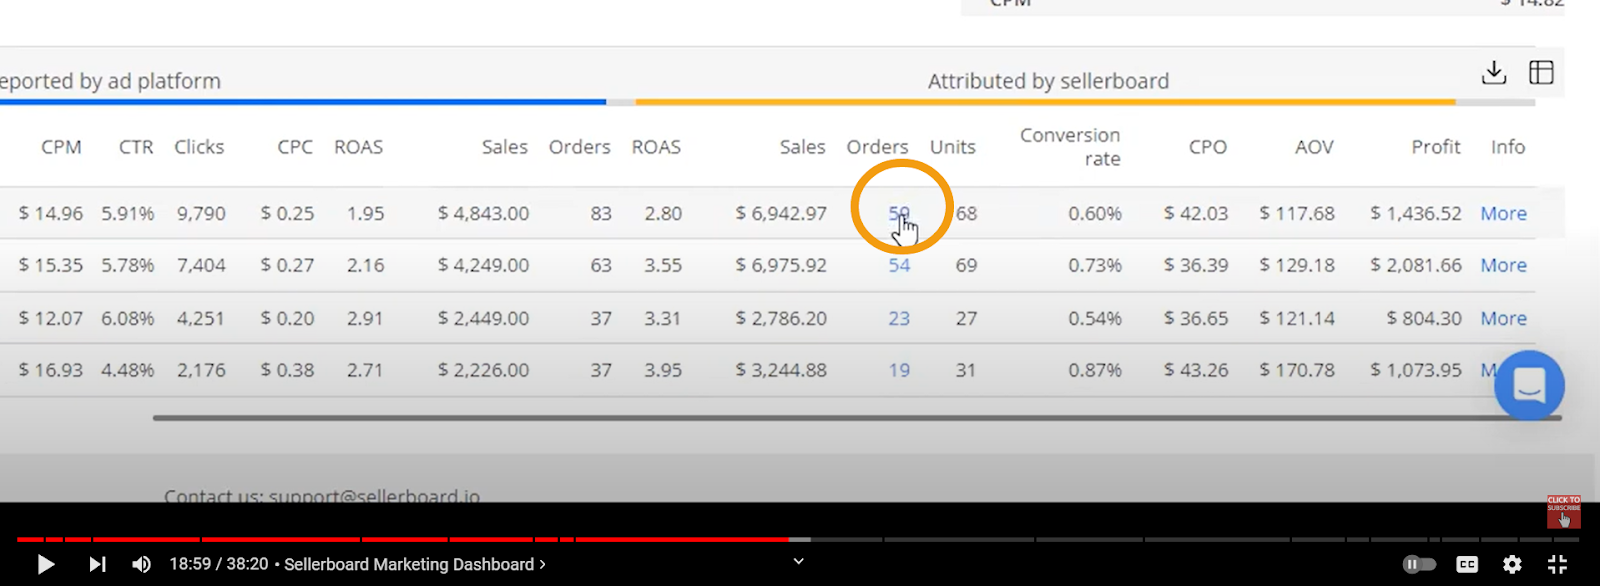
This will show you all of the orders that came from a specific advertising platform within the chosen time period.
You’ll be able to see details like the order date, order number, number of products, sales, and profit as shown in the screenshot below.
Likewise, clicking on "Customer Journey" will provide the data used to attribute the sale.
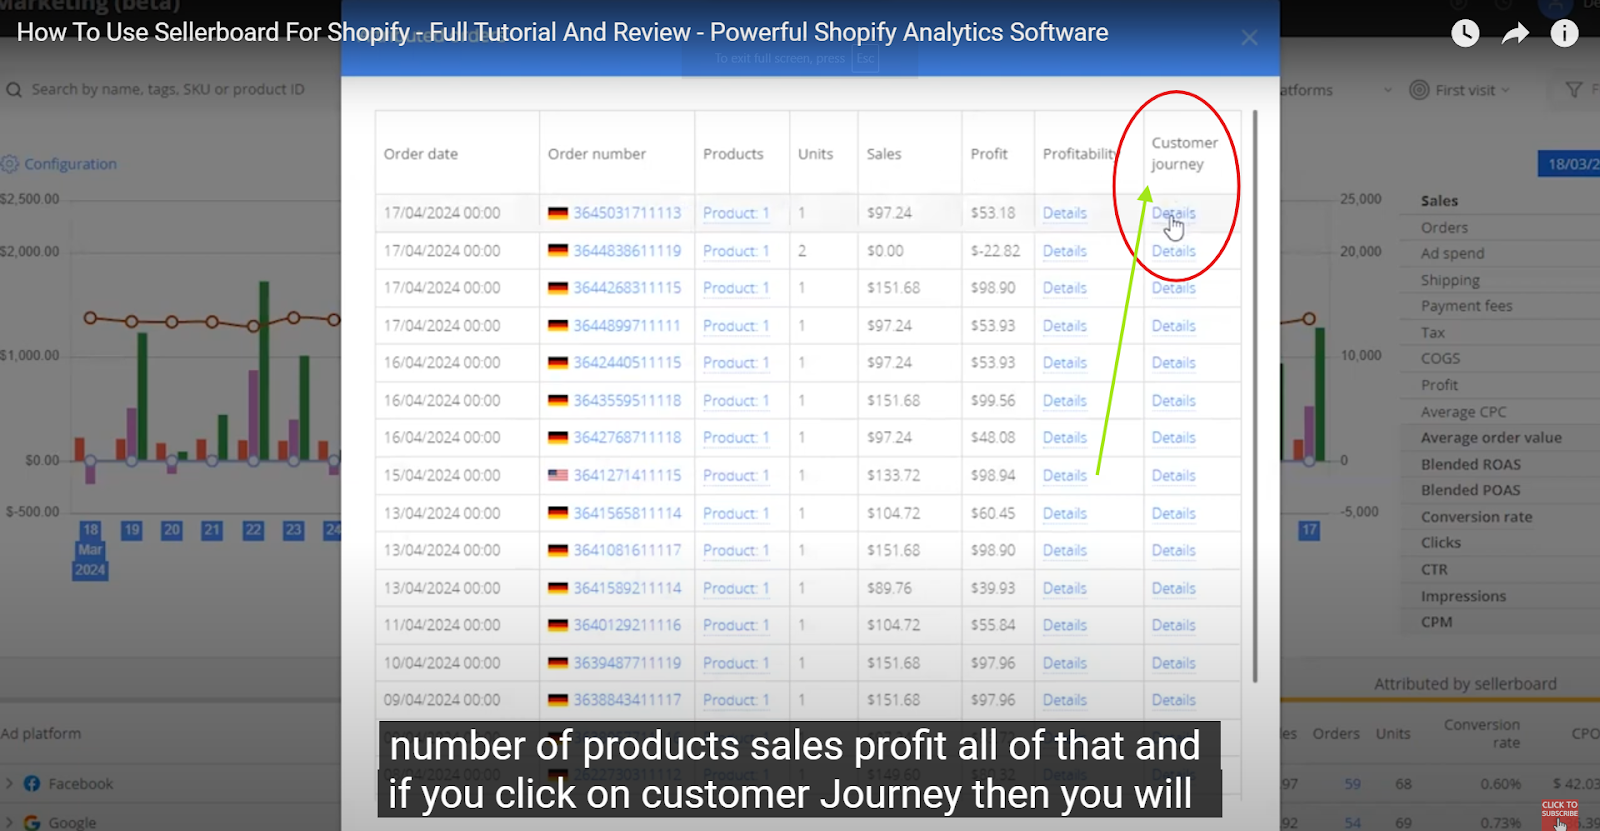

So, you can always see how many visits the customer made to your website, what their first and last visits were, the UTM metrics they brought with them, and additional details like the first landing page and the referring URL (the website they came from).
With all this data, we can attribute sales to your advertising efforts on different platforms more accurately than the platforms themselves.
I’m emphasizing this because I’ve personally encountered this problem.
I’m involved in selling on Shopify, and it was a headache not knowing if the conversions and metrics I saw on advertising platforms were accurate.
With this model, using data directly from Shopify, the calculations are much more precise.
Vova: Yeah, it’s a great feature that shows how people might visit your site from Facebook, leave, and then return after several days.
If they return from a different source, like typing in the website name, and then make a purchase, we still track that in the customer journey section.
We’ll see that the initial visit came from Facebook.
They don’t need to come from Facebook again for it to be attributed; they just need to make the purchase from anywhere.
Facebook won’t attribute it to their campaign if they came back by typing the website directly.
But Sellerboard, connected to Shopify, knows exactly where it started.
Cool, right?
Alex: Exactly, because we can identify that customer.
Shopify tracks the customer and recognizes them as someone who initially came from Facebook.
That’s why we attribute the sale to that platform.
Now, let’s move on.
Sellerboard Lifetime Value Dashboard
Besides accurate attribution, we also offer the Lifetime Value (LTV) dashboard, which is a great tool if you’re dealing with repeat business.
That means, if you have customers returning to your business, such as those buying consumables or bulk products, there's a good chance they’ll keep coming back as long as they're happy with your products and service.
The LTV dashboard lets you track accumulated sales per buyer.

For example, let's say that I have customers returning to my website and making multiple purchases over a specific period, like the last 3 months.
With LTV, I can analyze this time frame and see that the accumulated sales per buyer are higher than the price of the product I’m selling.
This indicates that, on average, a customer returned more than once to buy a product of this type.
I can analyze this on both an account level and a product level.
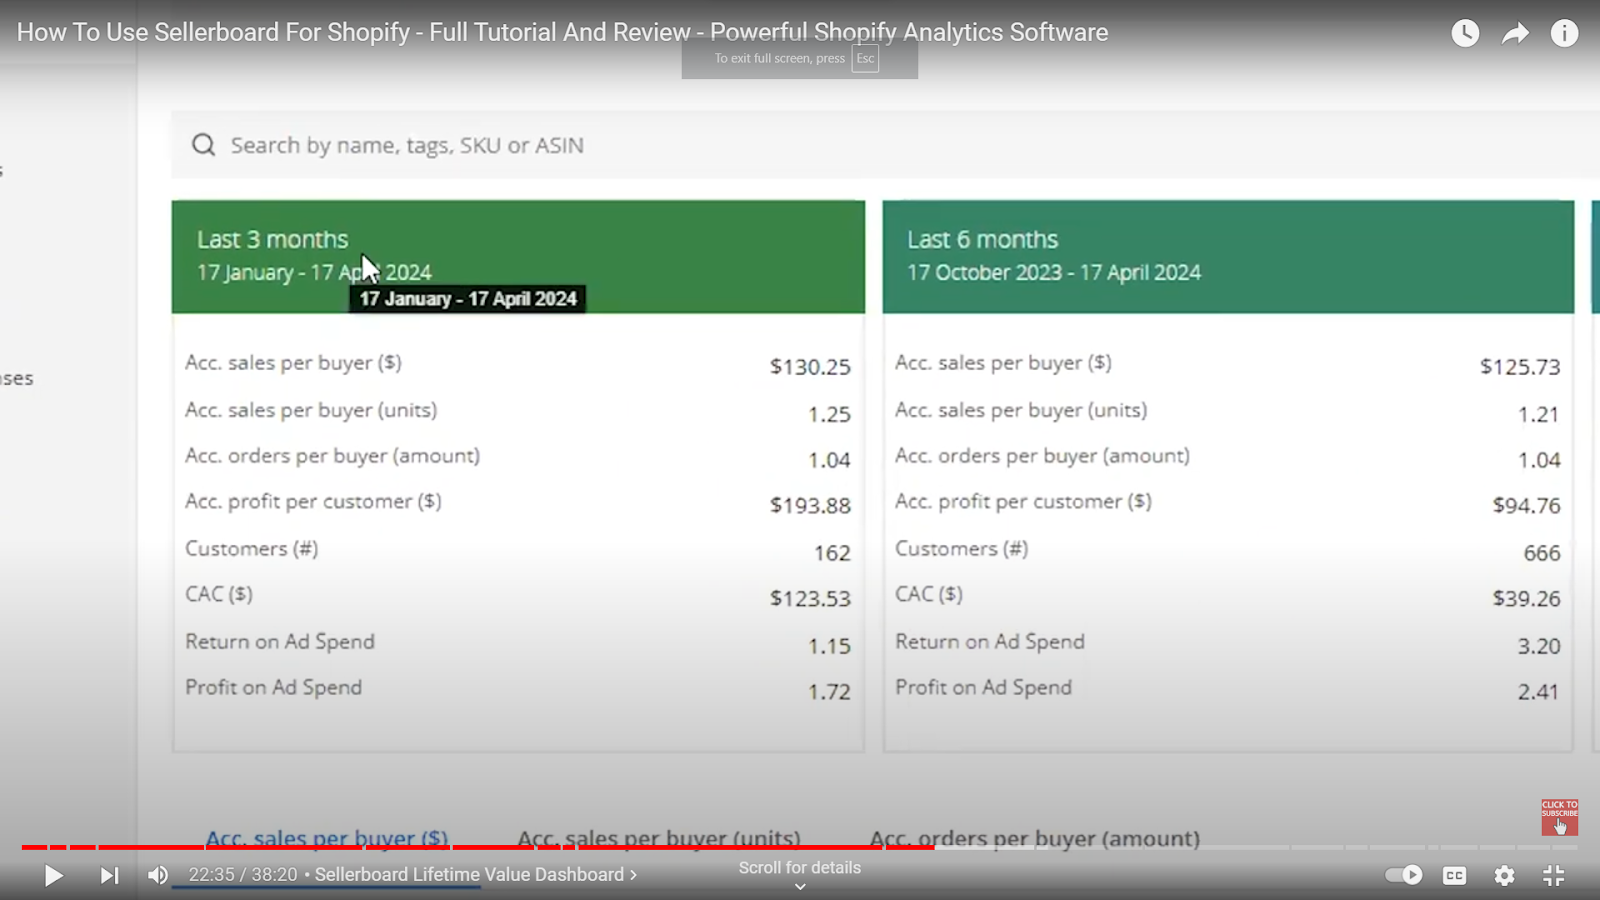
For an account level analysis, you can view data for the last 3 months, 6 months, 12 months, and 24 months.
And the main metrics include accumulated sales per buyer in terms of value, units, and number of orders, as well as accumulated profit per customer.
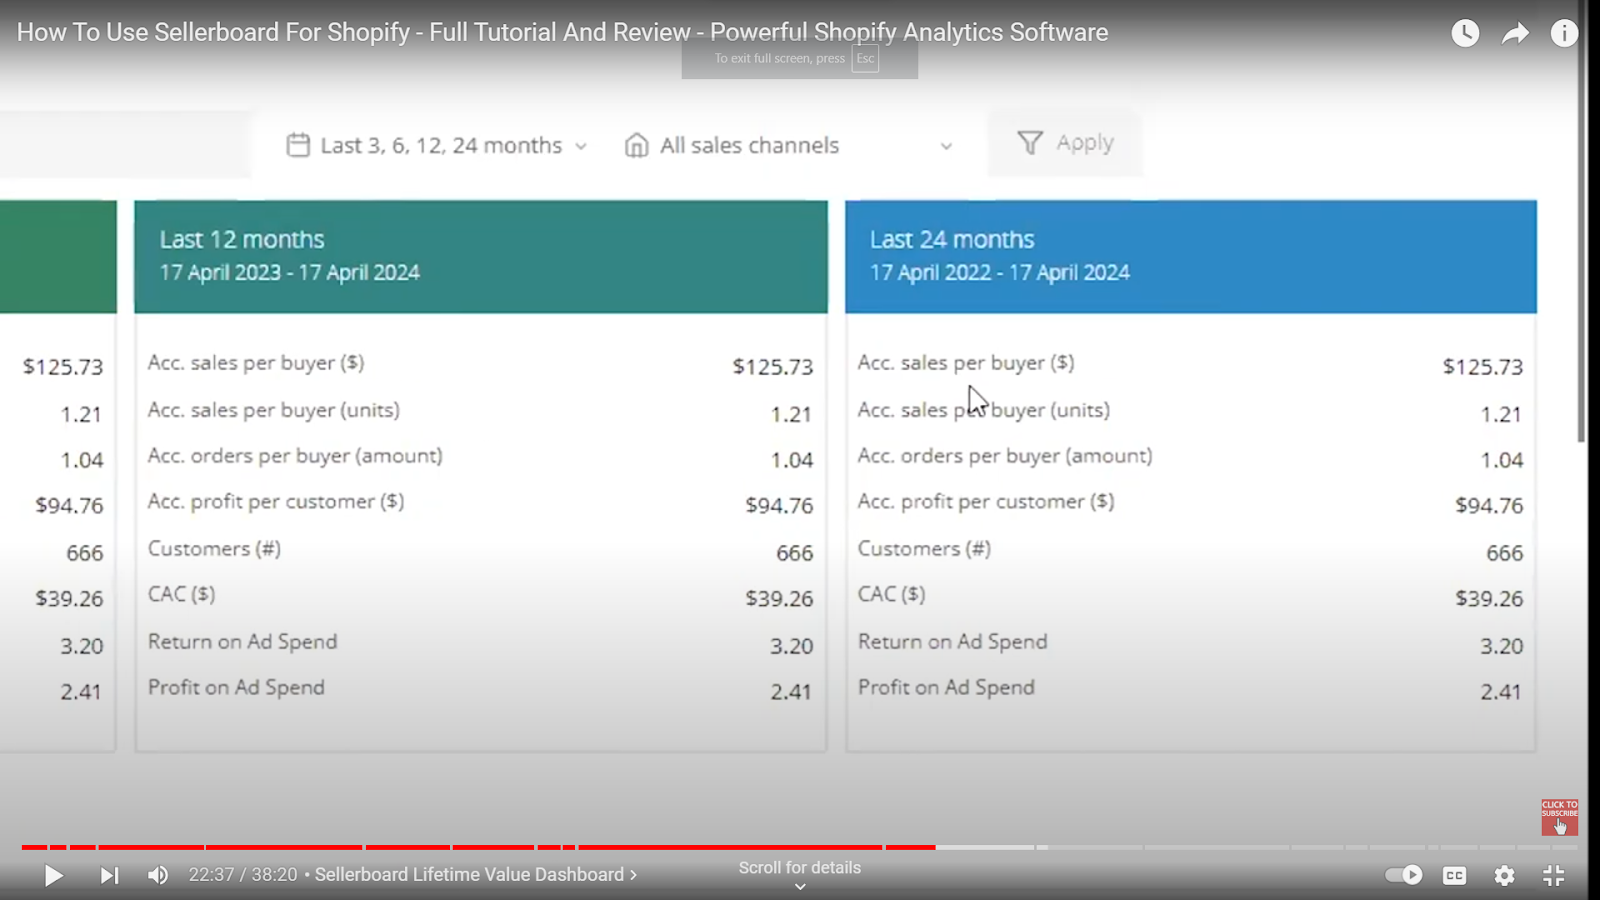
By analyzing this data, you can determine if you are improving your repeat business.
For instance, are you enhancing the customer experience to encourage repeat purchases?
If so, you'll spend less on marketing and advertising because returning customers are already motivated to buy again.
So, on an account level, you want to look at this data to understand if you're improving overall.
On a product level, you can see which products are being bought multiple times by the same customer.
This helps you plan your customer acquisition costs better.
In a competitive market, it might be necessary to make the first sale with no profit to attract the customer, with the expectation of earning from repeat purchases.
Imagine selling a product at zero profit just to bring a customer to your website.
If you’re confident they will make a second purchase, you won't have any additional customer acquisition costs for that second sale, as they already know about your website.
This means you’ll make a profit on the second sale without spending more on advertising.
So, you won’t make a profit on the first sale, but you’ll start making a profit with the second and third sales, and so on.
By analyzing your accumulated sales per buyer, you can see which products are purchased more than once.
If you find products with repeat purchases, it might be worth investing more in advertising them.
This way, you can increase sales and, as customers return to buy these products again, you’ll start making a profit with the subsequent sales.
So, it’s easier to plan your customer acquisition cost if you know the numbers for your accumulated sales per buyer.
That’s the goal here.
This dashboard helps you analyze those numbers effectively.
Now, let’s move on.
Sellerboard Products Page
The next thing is the products page.
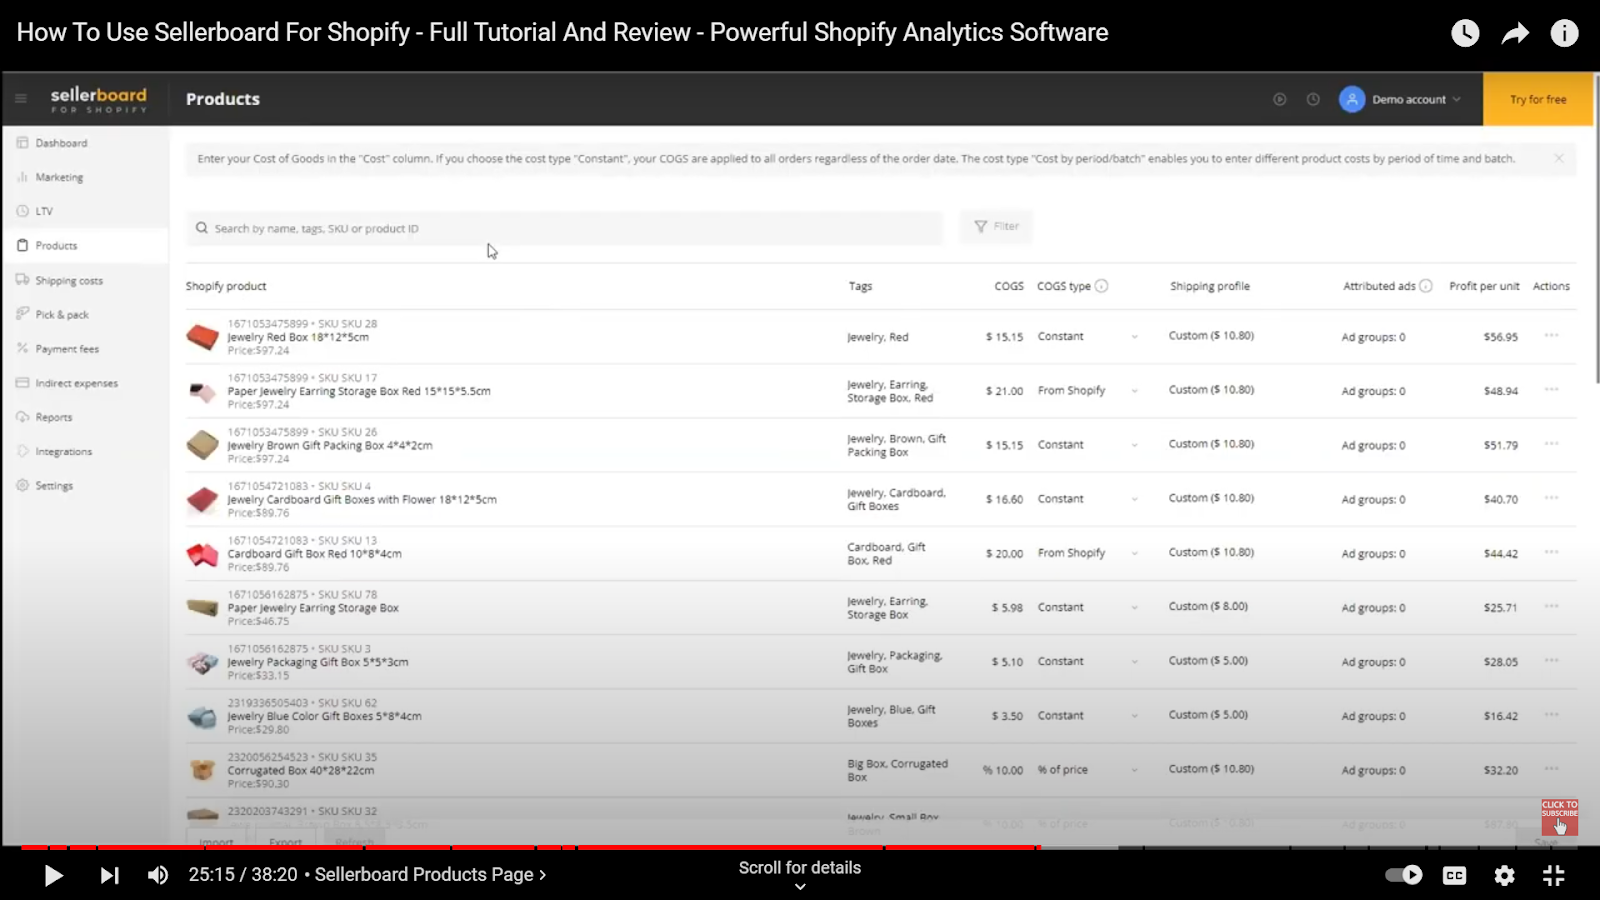
This page is more technical and shows all of your products pulled from Shopify.
You’ll have the option to set tags for your products, allowing you to analyze them in groups later.
Then, you’ll see options to set the cost of goods for your products.
We offer a lot of flexibility because there are many different selling models on Shopify.
Sellerboard for Shopify aims to provide tools that cater to various seller needs.
For example, the cost of goods is one area where we offer different setup options, depending on how you want to configure them.
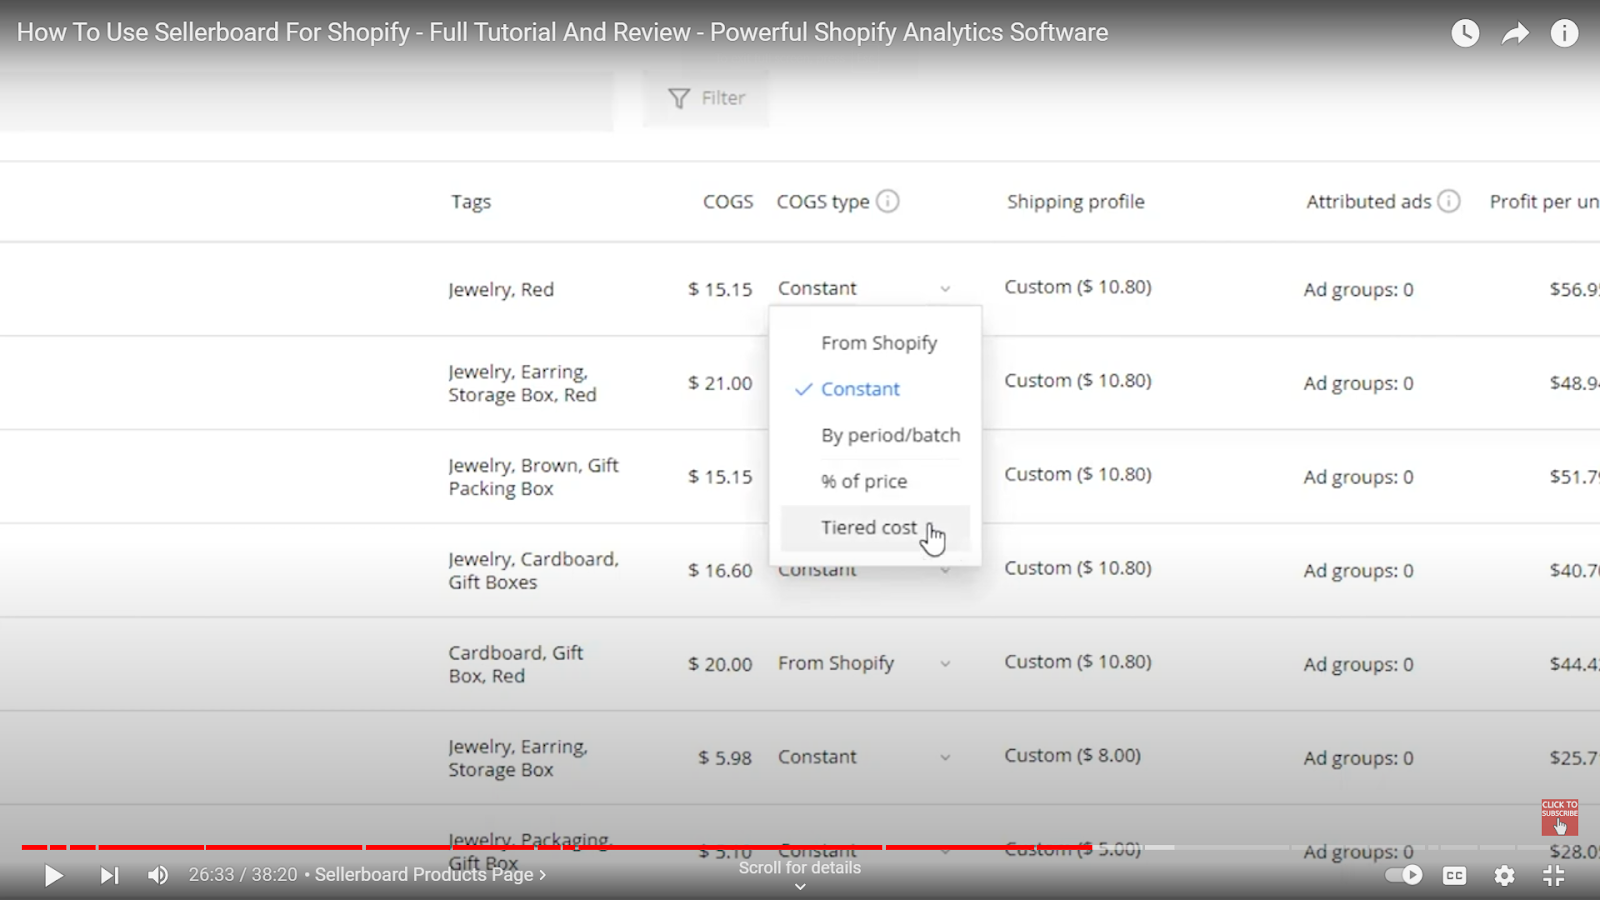
You can pull the cost directly from Shopify, input it as a constant, or set it by period or batch.
This is similar to the model we have on Sellerboard for Amazon.
Additionally, you can use two more options: a percentage of the price and a tiered cost.
These two options are often requested by dropshipping sellers because working with a percentage of the price for the cost of goods is more convenient for them.
Even with the tiered cost model, the cost of goods decreases as the customer buys more products at once because manufacturers often offer discounts for bulk purchases.
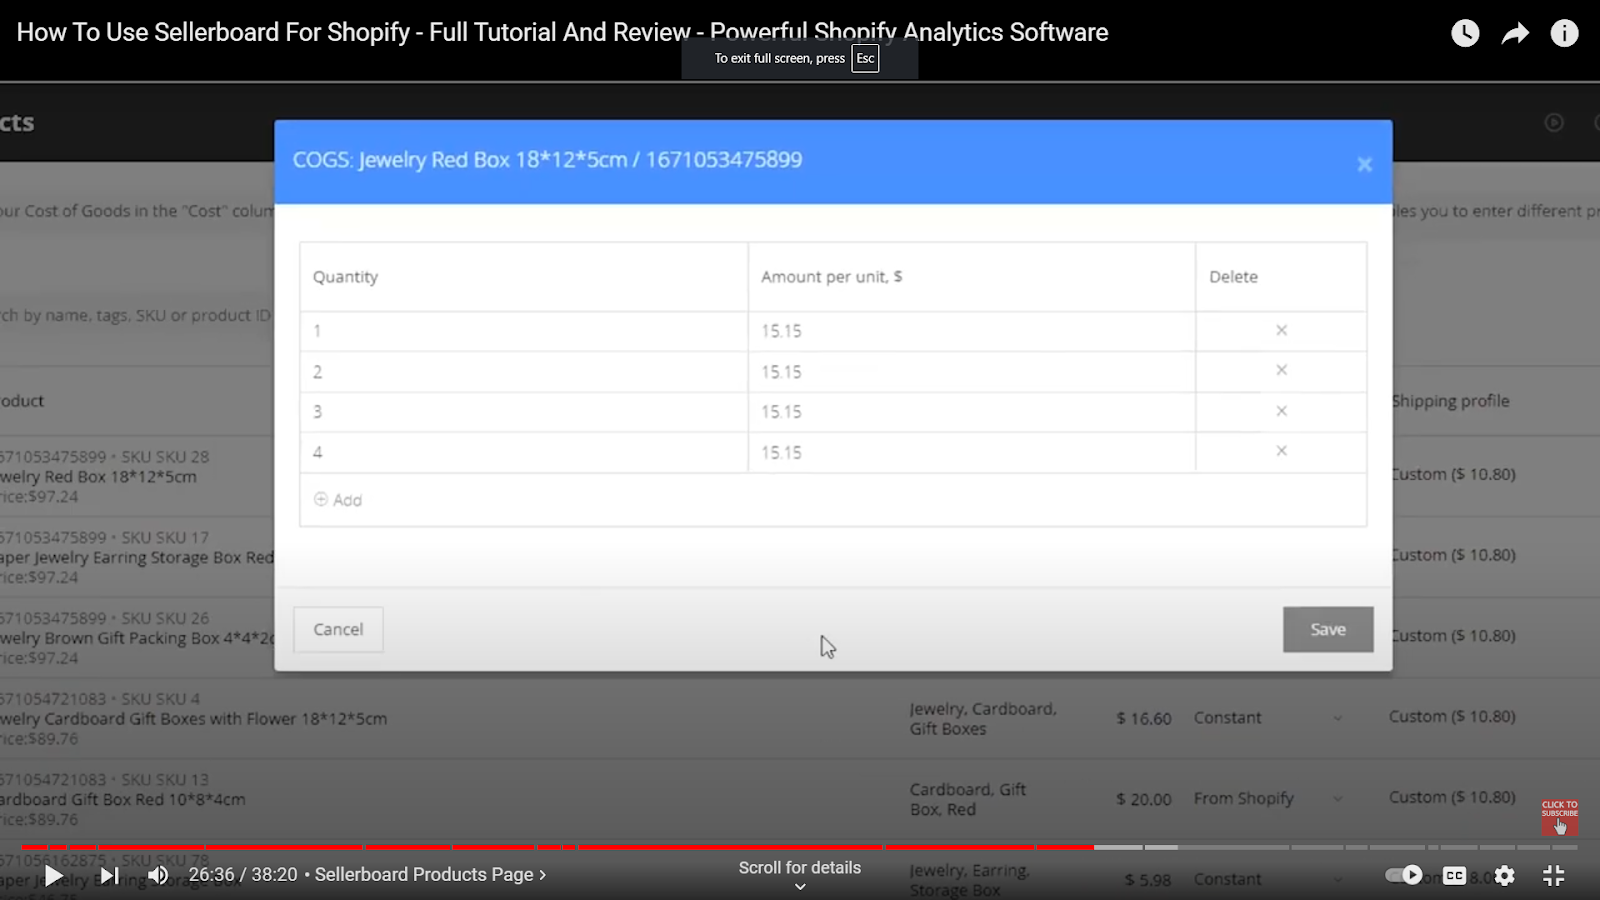
You can account for this lower cost of goods accordingly.
Plus, you'll need to set up your shipping profile.
Shipping Profile

Shipping profiles are important for profit calculation in Shopify because different products may have varying shipping costs.
Depending on the type of products you're shipping, you'll use different price calculation models.
I’m going to get to that in a minute, but you can assign those shipping profiles here in the Products view.

Additionally, you can always check your profit per unit.
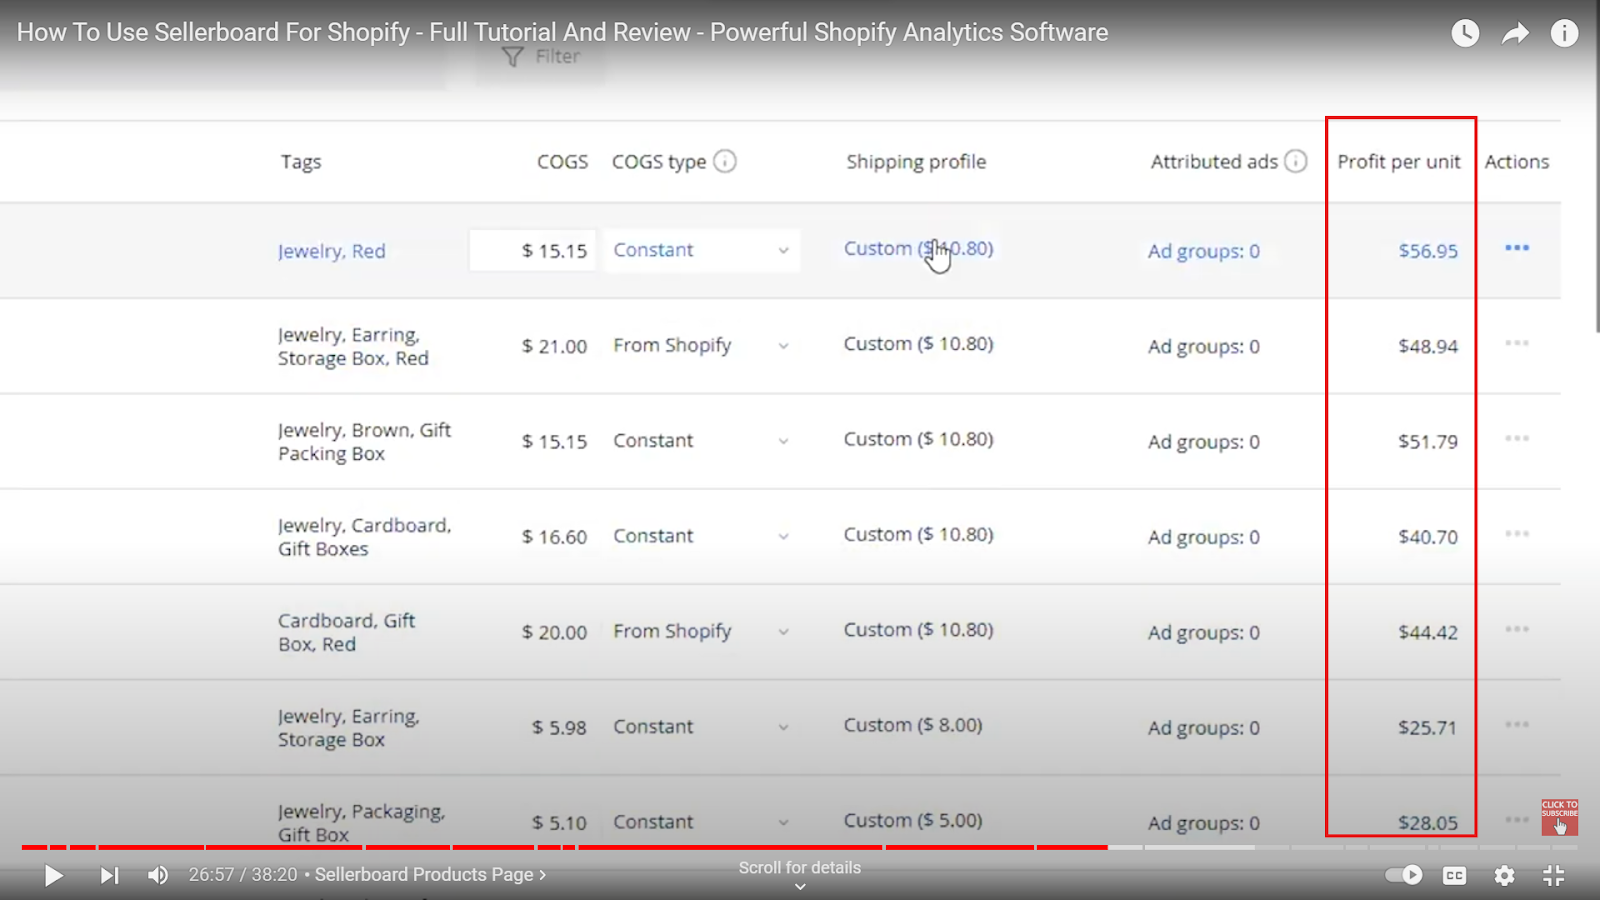
This feature shows how profitable it is to sell each product from your listings, based on the cost attributed to those products.
Not to forget, the import-export functions make it easier to update data in bulk.

If you have multiple products, you can use a spreadsheet to upload them, and Sellerboard will apply the values accordingly.
Moving on to Shipping costs dashboard: as mentioned, you can set up different shipping profiles for different products.
Shipping Costs
By default, there is a general shipping profile.

Let me click on "Edit" to show you the contents.
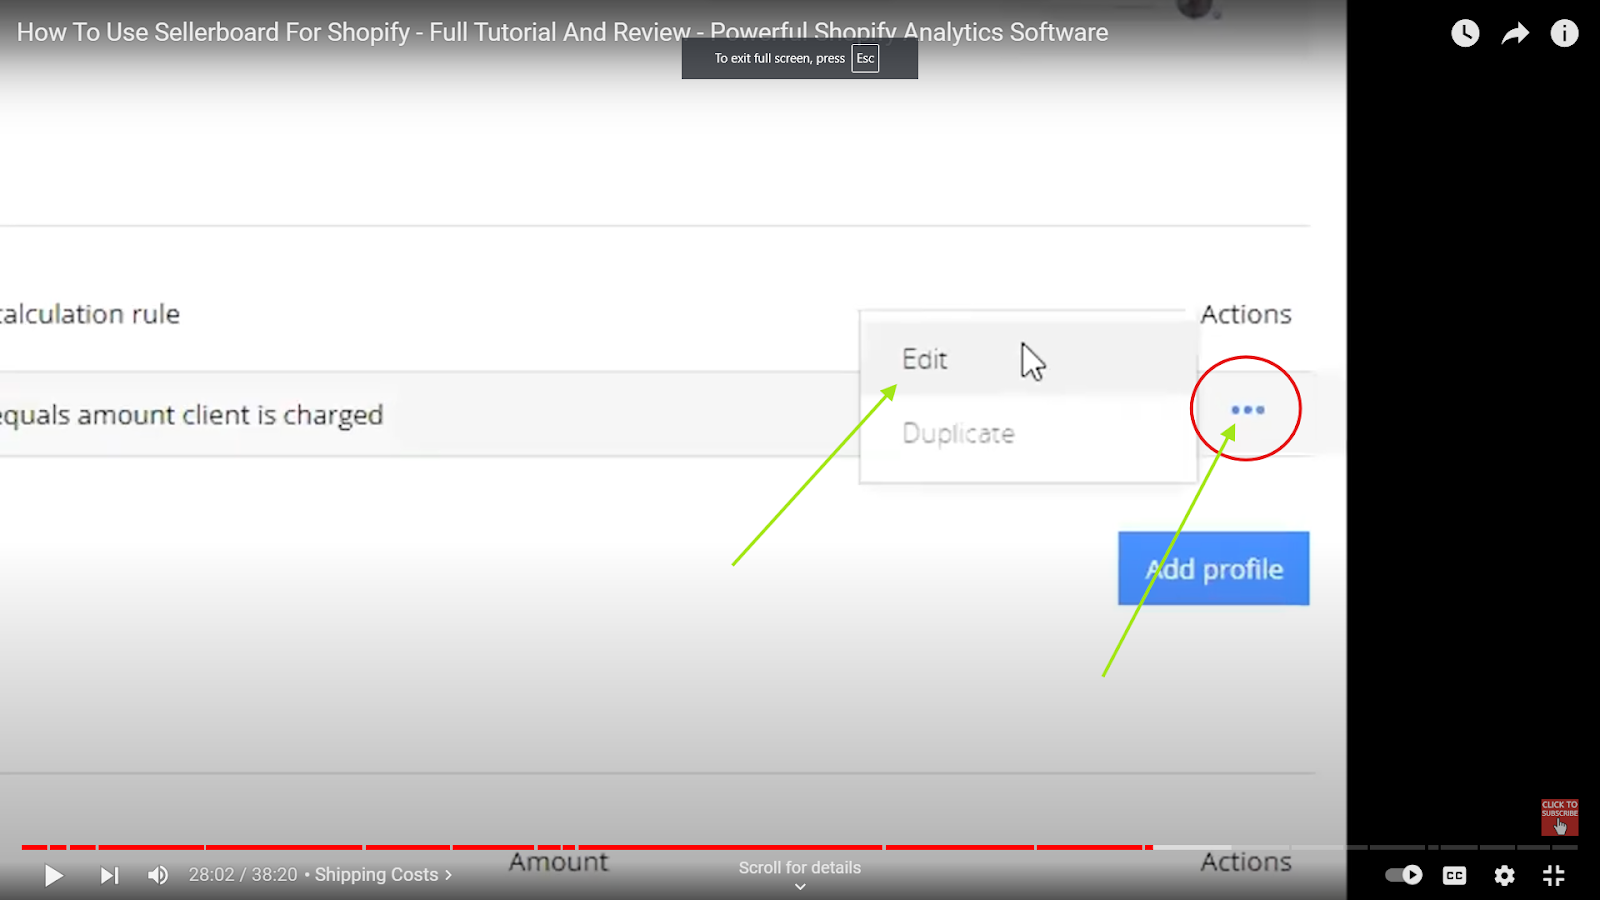
Basically, you set up rules for how shipping cost calculations will be done, with various models available.
For instance, you can set the shipping cost based on the amount the customer paid for shipping.

We can then use that data for calculations.
Other than this, you can set up a grid depending on the price, the number of units in the order, or the weight of the package.

So, if you choose weight, you would first select the units you're working with, based on the market and currency, and then set up your grid.
Let me set up a simple one.
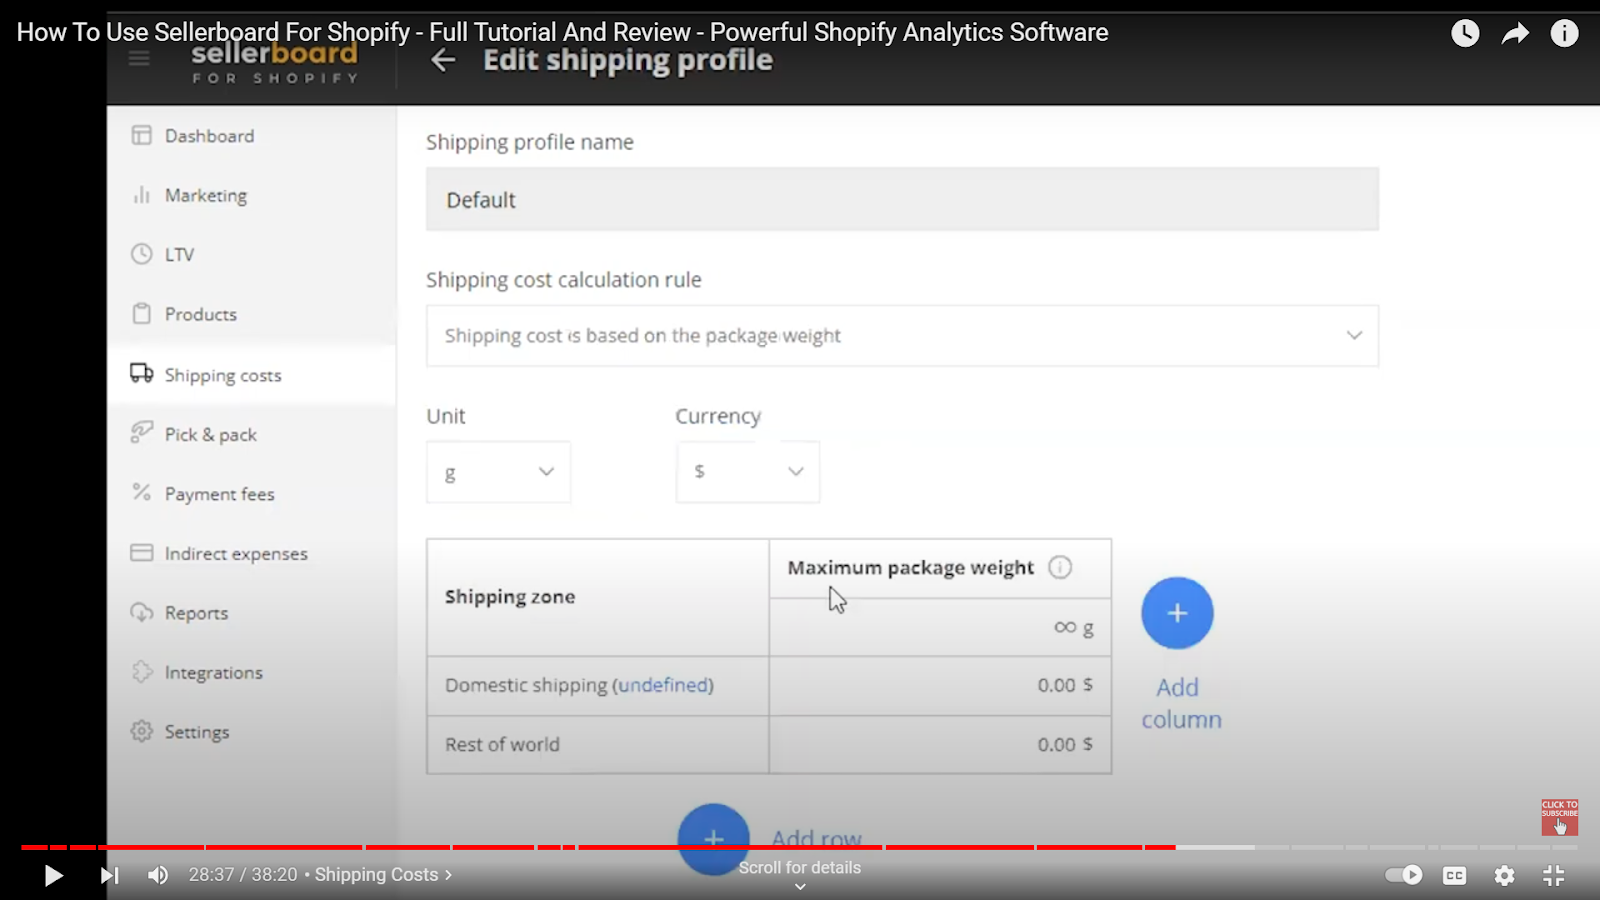
On the left, you choose values for domestic shipping and international shipping.
Then you set up tiers on the right side.
Let's say, in the first column, for the smallest packages by weight, you might charge $1 for domestic shipping and $2 for international.
If the package weight increases, say to 500 grams, you could adjust the charges to $2 domestically and $3 for international shipping.
For packages heavier than a kilogram, you might set higher charges.
This grid helps you align your shipping calculations with real-world scenarios.

This is the general profile setup.
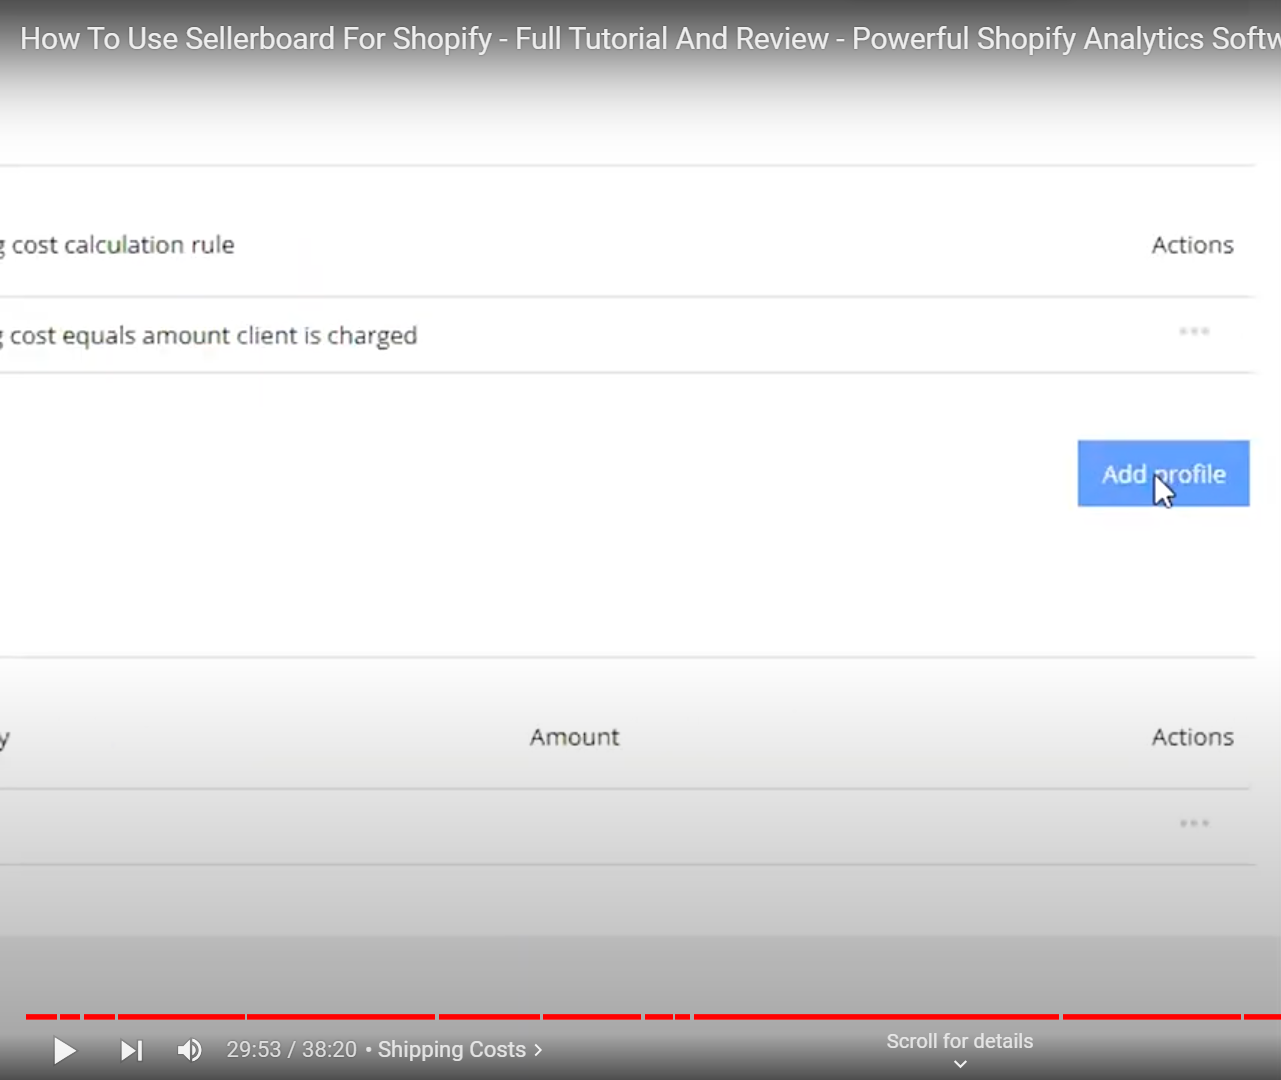
Besides this, you can create specific shipping profiles.
When you add a new profile, you’ll give it a name and can set it to be active for certain periods.
For example, you might have higher shipping costs during Q4.
Because of higher demand and increased shipping costs, you might have higher shipping fees during peak seasons.

Conversely, you can set lower shipping costs during off-peak periods when shipping rates are reduced.
You can apply a shipping profile to all products or select specific ones.

Different products and shipping methods can have their own profiles.
Shopify allows you to offer various shipping methods to customers, and you can create specific profiles for each method with different shipping calculation models.
Then, you will obviously select one of the rules which I’ve shown you in the previous example.
Besides that, another important aspect in Shopify is handling returns.
Unlike Amazon, where returns are managed by the platform, you need to handle returns yourself in Shopify.
It’s crucial to account for the cost of returns, as it’s an additional expense.
To manage this, you will need to set up a returned shipping profile or calculation rule.
You can either choose to set a fixed amount for a returned item or decide not to account for returns at all.
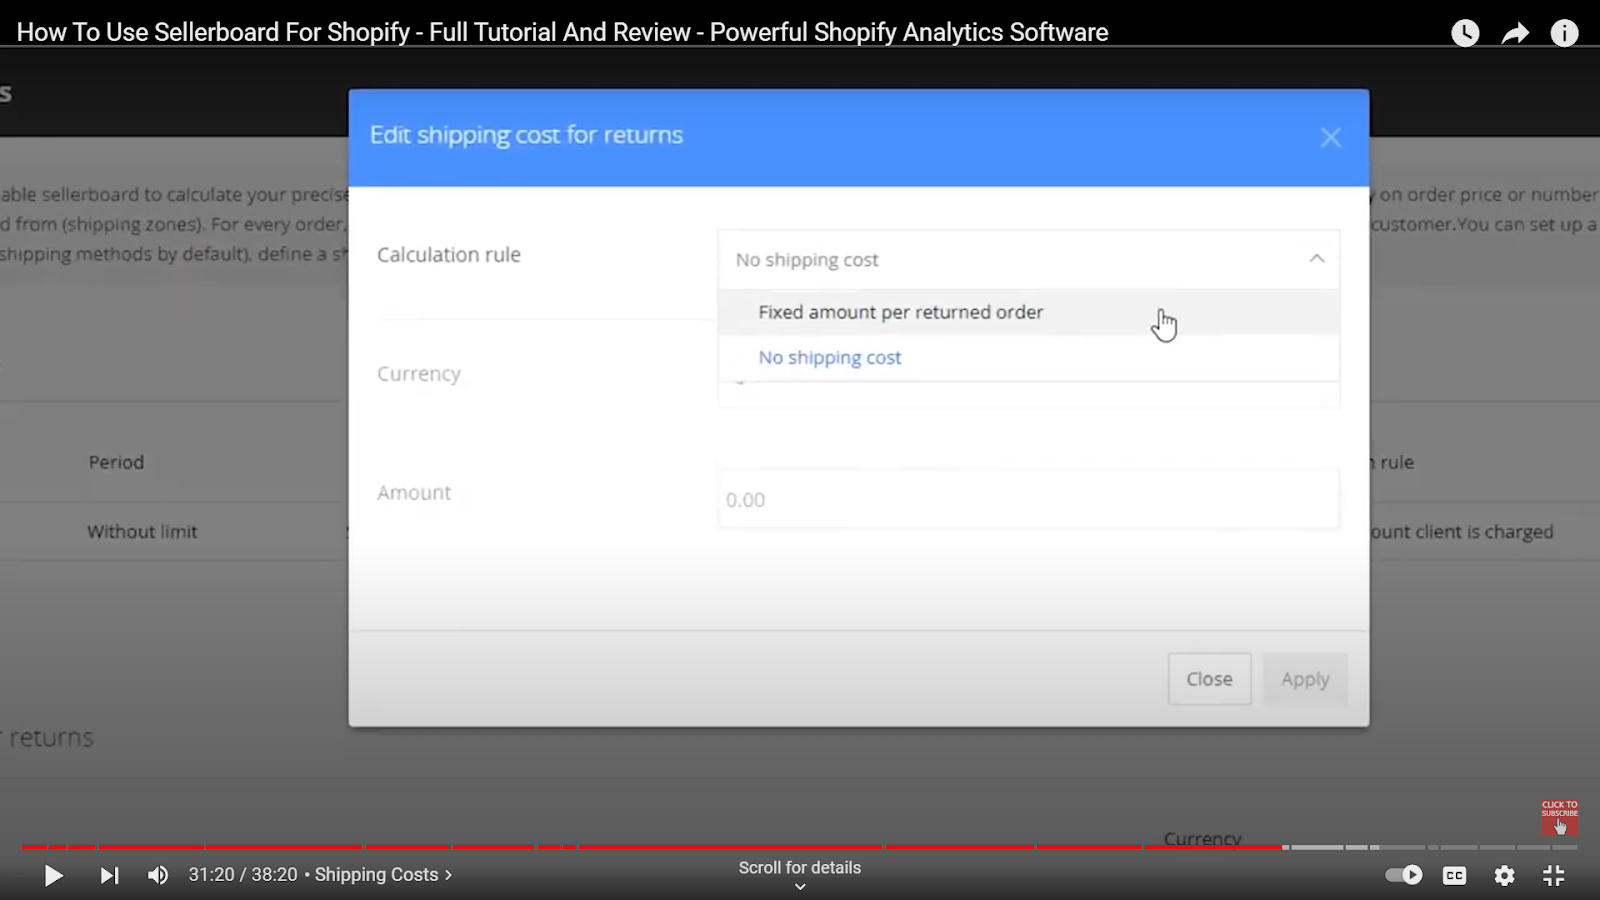
So, there are two options here.
Another important aspect when calculating profit for Shopify is pick-and-pack costs.
Sellerboard Pick and Pack

Unlike Fulfillment by Amazon (FBA), where most of these costs are covered by a fee, with Shopify, you need to specify these costs yourself.
For example, you might decide it costs 50 cents to pick and pack a product from the shelf.
Then, per package or per item, you can have different pricing options.
Depending on what the service provider offers, you might have a situation where packing multiple products of the same type costs differently.
For instance, they might charge a set amount for the first item and a lower rate for each additional item, since the initial setup cost is already covered.
There, in that section of the warehouse, the worker has already taken some products off the shelf, so he needs to do less work to get another product.
This is why the cost for picking and packing additional items is lower.
You can account for this, and also include the pick and pack cost for returns, since the warehouse must handle returns from customers.
Then, there's payment fees, as I mentioned earlier.
Sellerboard Payment Fees
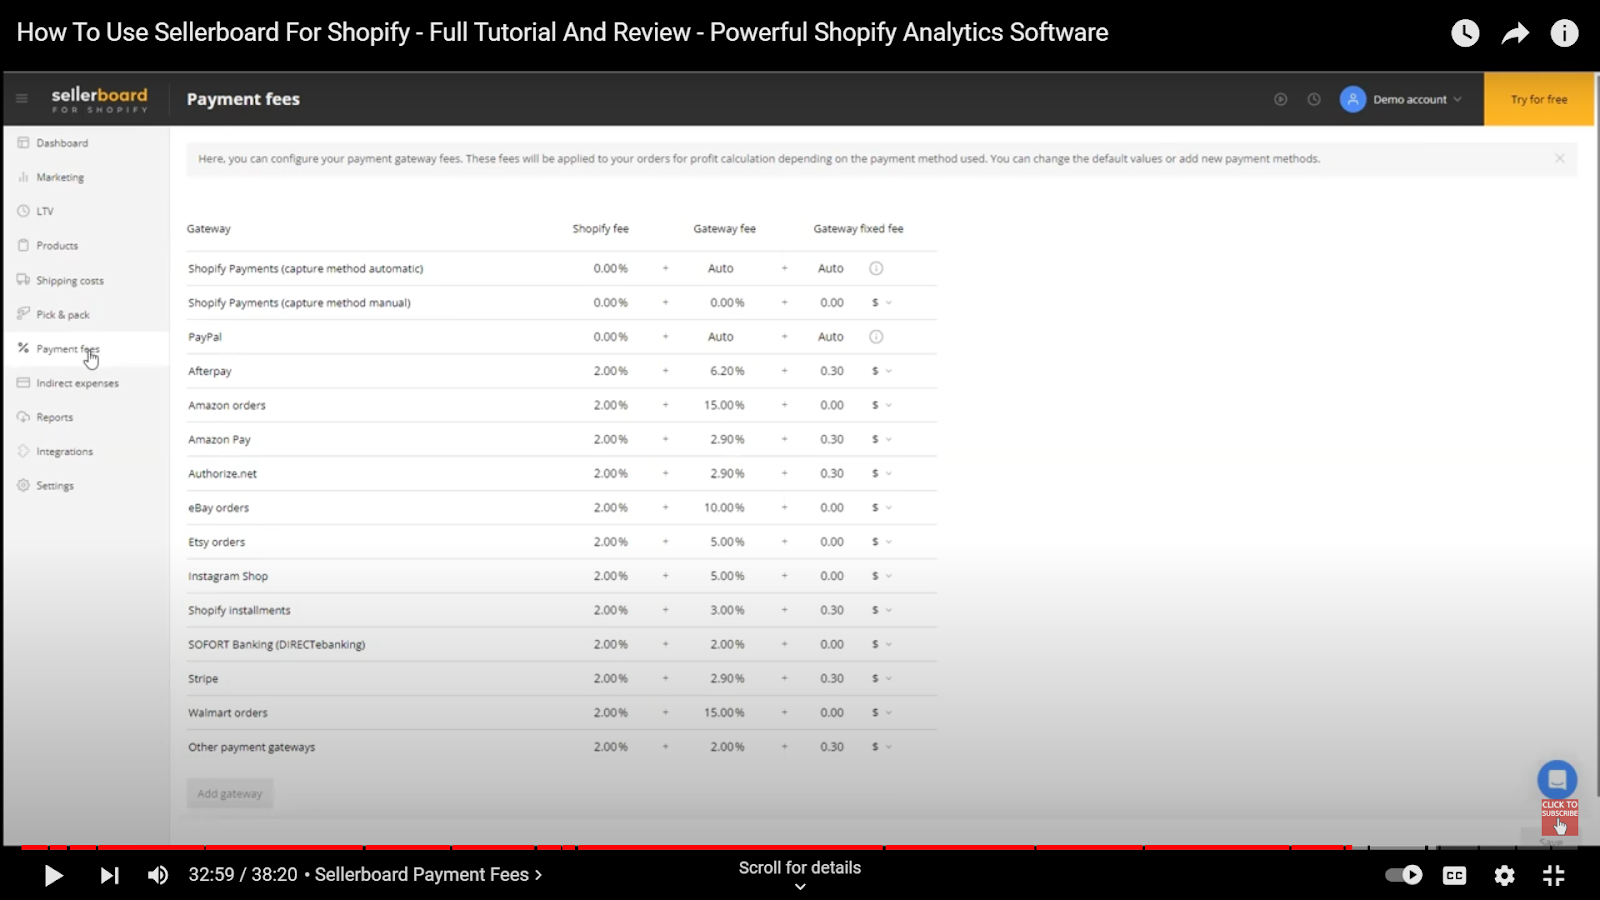
Customers visiting your Shopify store can choose different payment methods, and you may use various service providers for processing these payments.
Shopify applies specific fees to each method, which you can adjust here.
The model is straightforward as in the screenshot above, with main predefined calculations, but you can fine-tune them based on your needs.
All payment fee settings are located here.
Then, the indirect expenses: this is quite similar to what we have in Sellerboard for Amazon.
Sellerboard Indirect Expenses

This is the place where you account for additional overhead expenses.
Examples include services like photography, virtual assistance, packaging materials, and warehouse rent.
To add an expense, click on the "Add" button, provide a name, specify the price, and indicate whether it’s a one-time expense or recurring.

Then, you can check the box to indicate whether it’s an advertising cost.

This will transfer it to a separate tab in your profit calculations.
You can assign a category to it to analyze expenses by category.
Additionally, you can allocate specific expenses to individual products.
For example, if you have a photo shoot, you wouldn’t apply this expense to all products but only to those featured in the shoot.
These are the options for managing your overhead expenses.
Then, you have the option to download reports.
Some basic reports are available in this section.
Integrations

Under Integrations, you can connect your marketing channels.
It’s a straightforward process: choose the channel you’re using, click "Connect," and you’ll be redirected to your specific ad platform to make the connection.
Afterward, it may take some time — usually under an hour depending on the volume of data being processed — before your metrics appear in the marketing dashboard I showed you earlier.
Settings
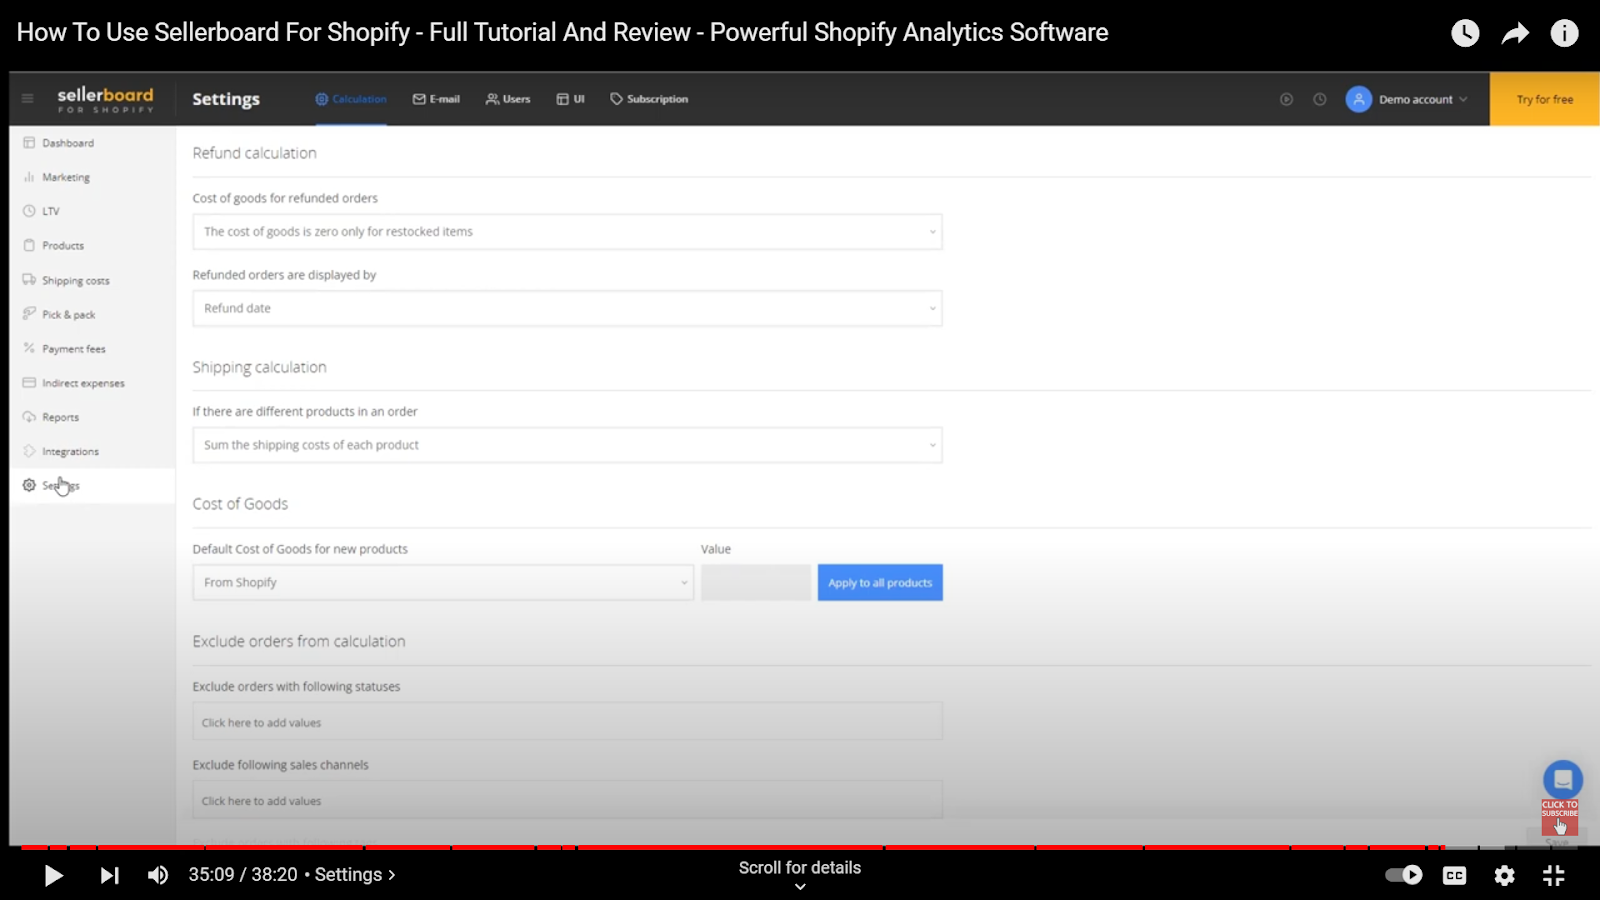
And the last thing is the Settings panel that includes some useful features that I recommend checking out.
There are options for refund calculations you should review.
One key point to note is that if you're selling on Shopify, it’s crucial to analyze not only all the metrics at the account level but also to examine each channel separately.
This is important because your strategies and situations might vary across different channels.
So, what you can do here is actually exclude some sales channels from the analysis and not include that data in your Sellerboard for Shopify account.
For instance, you might want to use this platform solely for analyzing a specific channel.
You can adjust these settings here, along with other exclusion options.
Users

The Users tab in the Settings is another important thing worthy to be mentioned.
If you're working with a team, you can invite other team members using this tab.
So, you click and add a user, specify the email where the invitation will be sent, and decide whether it will be a read-only account or if the user will have editing rights.
Then, you choose which parts of the software the new user will have access to.
Lastly, you can restrict access to a specific set of products if needed.
For example, if someone is managing only certain products from your assortment, this is where you would select those products.
That's it! I hope it wasn’t too overwhelming.
Vova: No, it’s pretty good, man.
I think we covered everything.
Extended Sellerboard Free Trial (2 months)
And I’ll remind our readers that I've got a free trial of two months for Sellerboard for Shopify.
You can click on the button below to grab it ASAP.
Sellerboard Pricing
Vova: Alex, do you have a few more minutes to go over the pricing of Sellerboard for Shopify?
Like, what it costs for different sizes of sellers?
Alex: Sure. Let me pull up the subscription page right here.

So, the plans are pretty much very similar.
As you can see, we have all of these checks in all of the columns, and you get basically the same functionality in all of the plans.
The main difference will be in the number of orders you have per month.
For example, for sellers with under 600 orders per month, it’s just $9 per month.
But remember, there’s a free trial period, so I recommend giving it a shot to see if it works for your business.
Vova: Perfect! Thank you for today, Alex. I appreciate your time. I think it was clear to me, and if anyone has any questions, of course, drop a comment on my YouTube video.
I'll get back to you or I'll ask Alex to help me if I don't know the answer.
Hopefully it was useful for y'all.
Alex: Sure, thank you for the invitation, Vova. It's been a pleasure. To everyone reading, I wish you good luck with sales.
Vova: Thank you. By the way,we also have an article about pricing of Sellerboar for Amazon.
Discover More: Sellerboard Discount Code: Set Yourself Up For Success
Conclusion
To wrap things up, we’ve covered a lot about using Sellerboard for Shopify and how it can help you track and manage your sales better.
We went over how to analyze your sales data, set up your products and shipping profiles, and handle various costs like pick-and-pack and payment fees.
Remember, if you’re new to Sellerboard, you can try it out for free for two months through the button below.
And if you’re also selling on Amazon, we have a tutorial for that as well.
-: Video Version :-
-: Blog Version :-
How to Use Sellerboard - Detailed Tutorial & Review
Plus, here's the deal for Amazon sellers:
Thanks for reading, and I hope this information helps you run your Shopify store more smoothly. Have a great day!
-
Learn How to Use Sellerboard for Shopify
-
Introduction
- Meet My Guest: Alexandr Speian
-
The Main Difference Between Selling on Amazon and Shopify
-
Sellerboard Dashboard Review
-
How to Switch Between Different Marketplaces On Sellerboard
-
Sellerboard Marketing Dashboard
-
Sellerboard Lifetime Value Dashboard
-
Sellerboard Products Page
-
Shipping Profile
-
Shipping Costs
-
Sellerboard Pick and Pack
-
Sellerboard Payment Fees
-
Sellerboard Indirect Expenses
-
Integrations
-
Settings
-
Users
-
Extended Sellerboard Free Trial (2 months)
-
Sellerboard Pricing
-
Conclusion
Disclosure: Hi! It's Vova :) Some of the links in this article may be affiliate links. I get a commission if you purchase after clicking on the link, this does not cost you more money, and many times I can even get a nice discount for you. This helps me keep the content free forever. For you. Thank you! :)